
- XAU/USD climbs as falling US Treasury yields boost demand for non-yielding assets.
- Traders anticipate rate cuts from major central banks as inflation cools with the ECB expected to act on October 17.
- Geopolitical uncertainty and upcoming US elections fuel demand for Gold as a safe-haven asset amidst economic slowdown fears.
Gold prices rose during the mid-North American session on Wednesday, underpinned by the drop in US Treasury yields and the shrug off recent US Dollar strength. Expectations that major central banks would cut rates amid soft inflation readings weighed on bond yields and boosted the non-yielding metal. At the time of writing, the XAU/USD trades at $2,674, up by 0.46%.
Market sentiment has improved lately, as portrayed by three of the four US equity indices trading in the green. US Treasury bond yields had extended their fall, a tailwind for Bullion prices, which hit $2,685, the year-to-date (YTD) high, yet lacked the strength to push prices toward $2,700.
During the European session, inflation in the UK tumbled below the Bank of England’s (BoE) 2% goal. Hence, the BoE is expected to resume its easing cycle in tune with the Federal Reserve and the European Central Bank. Traders expect the ECB to lower rates on October 17 as inflation aimed toward the bank’s target and also on fears the bloc’s economy is at risk of hitting a recession.
Gold climbed as traders seeking safety bought the dip amid woes that the global economy could be headed for a slowdown and uncertainty on upcoming US elections.
UBS analysts wrote, “We anticipate uncertainty and volatility to rise until the next US administration is settled,” and suggested that gold and oil could be “effective portfolio hedges.”
In the meantime, according to the CME FedWatch tool, traders see a 96% chance of a 25-basis-point US rate cut in November.
The lack of economic data keeps traders focused on Middle East developments and China’s stimulus program.
Market participants’ attention turns to upcoming US Retail Sales, Industrial Production data, and Initial Jobless Claims due later this week.
Daily digest market movers: Gold price climbs as investors eye key US data
- Gold prices remained underpinned by the fall of the US 10-year Treasury bond yield.
- The 10-year benchmark note rate is down two basis points to 4.014%.
- Despite that, overall US Dollar strength has capped Bullion’s rally toward $2,700.
- The US Dollar Index, which tracks the buck’s value against a basket of six currencies, gains 0.34% to 103.57.
- Data from the Chicago Board of Trade, based on the December fed funds rate futures contract, indicates that investors are pricing in 50 basis points (bps) of easing by the Fed in the last two months of 2024.
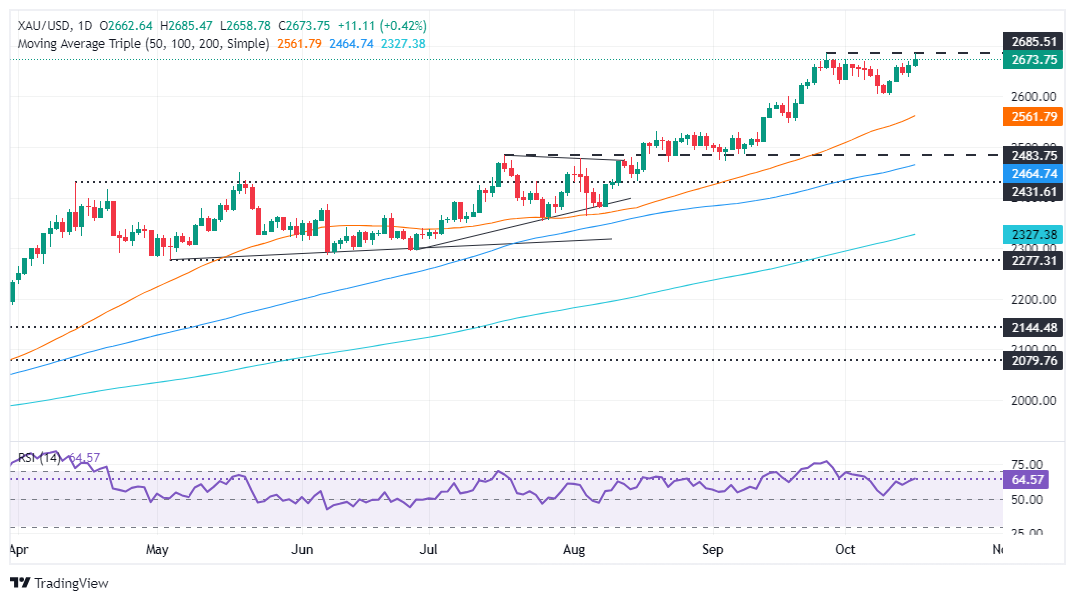
XAU/USD technical outlook: Gold price surges above $2,670, eyes on YTD peak
The uptrend of Gold remains in place, with buyers launching their first attack to the YTD high of $2,685, yet they fell short of cracking the latter. Momentum remains bullish, as shown by the Relative Strength Index (RSI), opening the door for higher prices.
Therefore, Gold’s first resistance is the YTD high at $2,685. Once cleared, a move to $2,700 is on the cards, followed by $2,750 and $2,800.
Conversely, if XAU/USD falls below the October 4 high at $2,670, a retracement toward $2,650 is on the cards. On further weakness, the next support would be $2,600, followed by the 50-day Simple Moving Average (SMA) at $2,561.
Economic Indicator
Retail Sales (MoM)
The Retail Sales data, released by the US Census Bureau on a monthly basis, measures the value in total receipts of retail and food stores in the United States. Monthly percent changes reflect the rate of changes in such sales. A stratified random sampling method is used to select approximately 4,800 retail and food services firms whose sales are then weighted and benchmarked to represent the complete universe of over three million retail and food services firms across the country. The data is adjusted for seasonal variations as well as holiday and trading-day differences, but not for price changes. Retail Sales data is widely followed as an indicator of consumer spending, which is a major driver of the US economy. Generally, a high reading is seen as bullish for the US Dollar (USD), while a low reading is seen as bearish.
Next release: Thu Oct 17, 2024 12:30
Frequency: Monthly
Consensus: 0.3%
Previous: 0.1%
Source: US Census Bureau