Trading successfully needs to focus on risks and putting the odds of success in your favor.
That can manifest in different ways but one way is recognizing a pattern by traders.
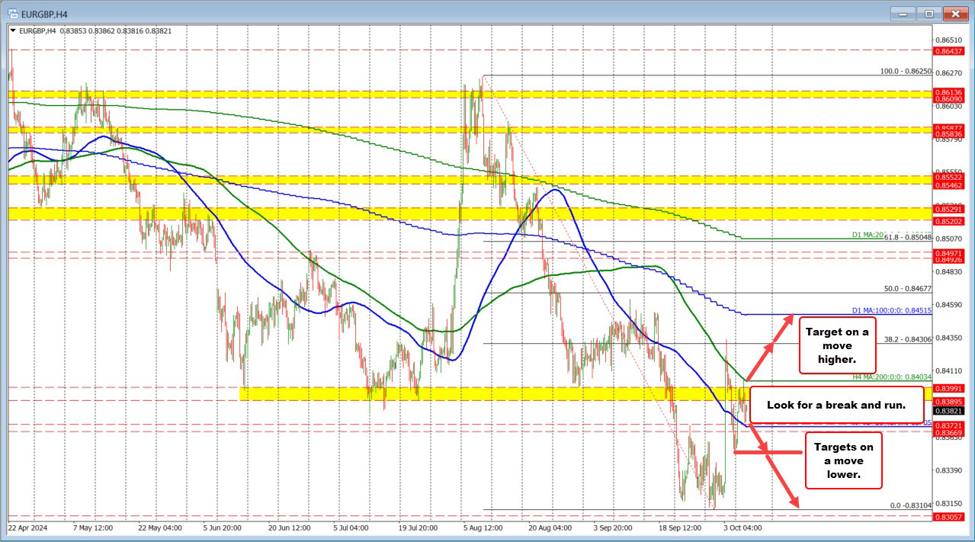
When I look at the EURGBP, the pattern on the 4-hour chart is simple. In trading today:
- The 200-bar MA stalled the rally today (green line). That MA is currently at 0.8403
- The 100 bar MA stalled the fall today (blue line). That MA is currently at 0.83705.
When this occurs, the buyers and sellers are battling between the MAs, but support and resistance are putting a lid and floor on the pair.
At some point, that dynamic will not persist forever. What traders hope, is a break higher or lower leads to momentum in the direction of the break.
Of course, the break can fail. We all know there is no guarantee, but the good news is the risk does not have to be great.
If the price breaks (and you buy or sell on the break) and the price does not see momentum over time on the break and returns into the neutral area (between the MAs), get out.
What traders hope, is the reward of a break and run will make up for those whips when the market is still not ready to run with momentum.