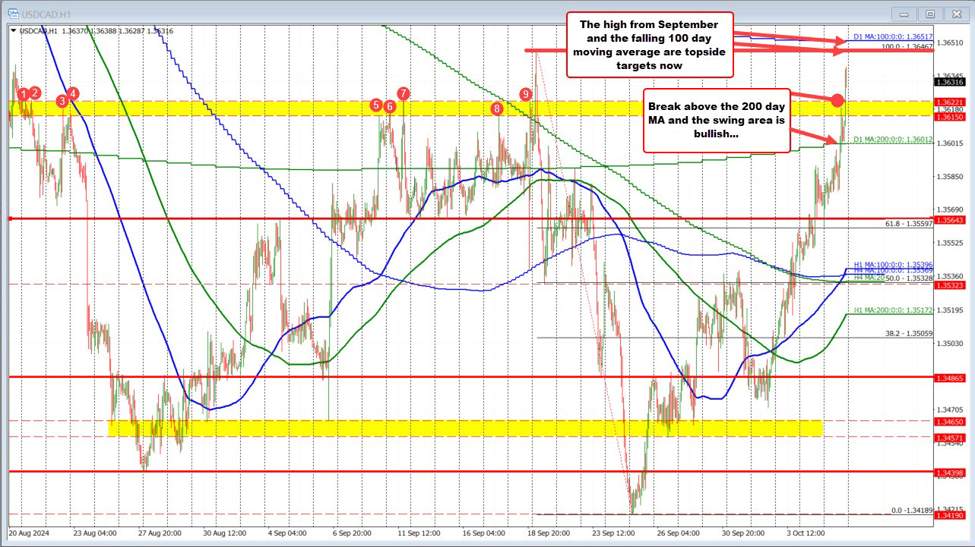
The USDCAD has broken above the swing area between 1.3615 and 1.3622 (see earlier video). Earlier today, the price extended above its 200-day moving average at 1.36012, and then based against the moving average before moving higher.
The buyers continue to push and are now looking toward the high price from September which came in at 1.36467. Above that is the falling 100-day moving average of 1.36517. Moving above the 100 day moving average would open the door for further upside momentum.
The AUDUSD and the NZDUSD are also extending to new extreme:
The AUDUSD has moved below the 200 bar MA on the 4-hour chart and its 50% midpoint of the move up from the September low at 0.67813. That increased the selling momentum and the price is currently below a swing area at 0.6748 and 0.6760. The price is currently testing the 61.8% at 0.67436..
For the NZDUSD, it has dipped below the 50% midpoint of the range since the August low at 0.6113. The 200 day moving average remains a key target at 0.60981 (see video HERE).