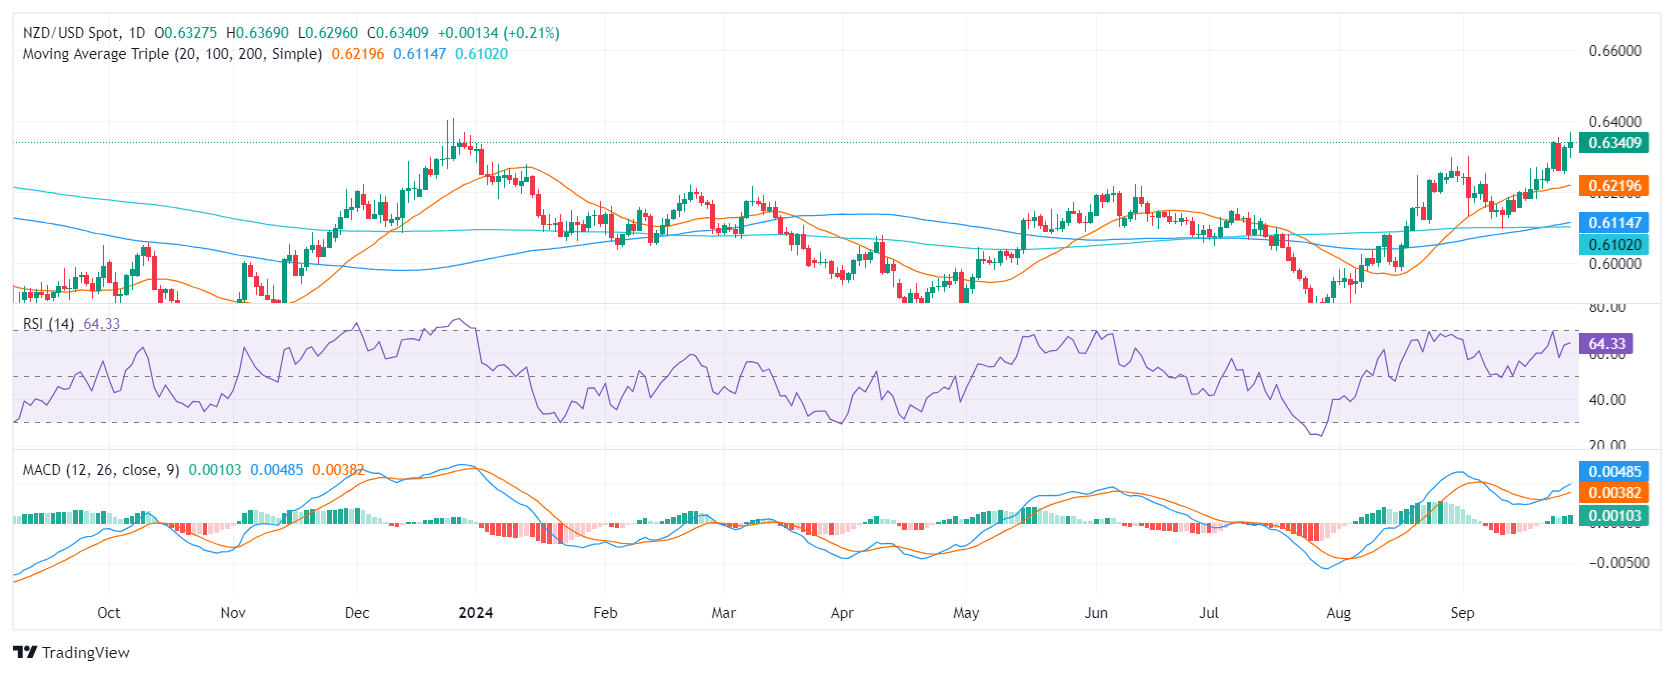
- The NZD/USD climbed to fresh highs since December.
- The RSI stands deep in positive area and the MACD shows rising green bars supporting an overall bullish outlook.
- If the bulls fail to conquer 0.6400, it might trigger a downward correction.
On Friday, the NZD/USD pair continued its ascent from Thursday, adding 0.20%, reaching 0.6354 and continuing the bullish trend.
The technical indicators suggest that the buying pressure is likely to continue. The Relative Strength Index (RSI) is currently at 66, which is near the overbought area. This suggests that buying pressure is strong but that the movements might have become over-extended. The Moving Average Convergence Divergence (MACD) is also bullish, with the histogram rising and green.
NZD/USD daily chart
The overall outlook for the NZD/USD is bullish. The pair is trading above its key moving averages, and the technical indicators are regaining strength. Buyers seem to have hit a solid resistance at 0.6350, but buyers might be preparing to retest it. A break above could pave the way for more upside and the pair could test the 0.6400 level. On the other hand, a rejection at this level might trigger selling pressure and the bears might target the 0.6300 area and even more push the pair down to the 0.6250-0.6200. That being said, if the pair holds the 20-day Simple Moving Average (SMA) at 0.6220, the bullish outlook will remain intact.


 This “NEW CONCEPT” Trading Strategy Prints Money!… (INSANE Results!)