Fundamental
Overview
The Yen is having another good
week as the USDJPY pair dropped to new lows as Treasury yields continue to fall.
We had two possible catalysts yesterday.
The first one was the much
weaker than expected US
NFIB Index which dropped to a 3 month low. There wasn’t an immediate
reaction in the markets on the release, but things started to move as the American
session began.
The second one was a
comment from BoC’s
Macklem where he said that bigger cuts are possible if the economy and CPI
were weaker. There’s generally a groupthink with central banks, so the market
might have projected that to the Fed’s decision next week.
The probabilities for the
Fed to cut by 50 bps at the upcoming meeting increased to 35% and a soft US CPI
report today might get us back to a 50/50 chance between 25 and 50 bps cut. For
the BoJ, the market sees a 100% probability of no change at the upcoming
meeting and a total of 8 bps of easing by year-end.
USDJPY
Technical Analysis – Daily Timeframe
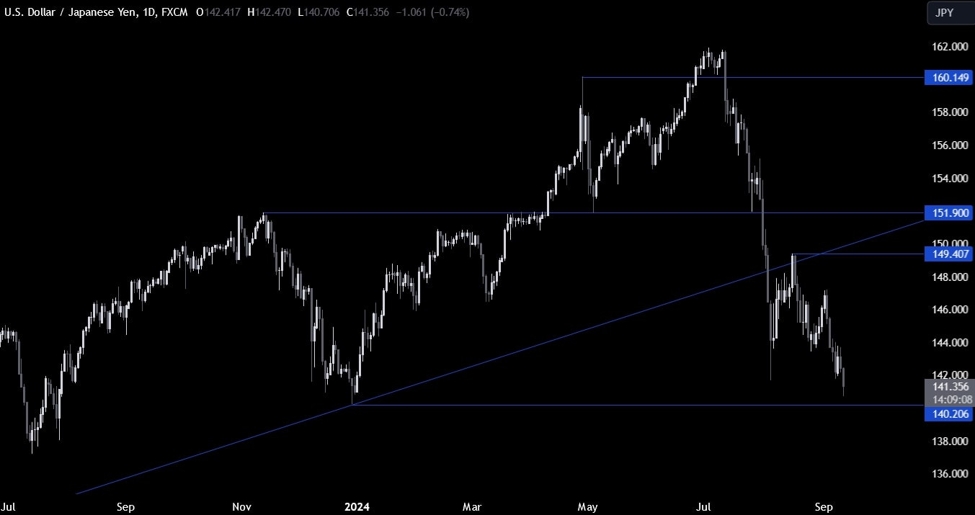
USDJPY Daily
On the daily chart, we can
see that USDJPY eventually broke through the August low and almost touched the
key 140.20 level. The buyers will likely start to pile in around these levels
to position for a rally into the 150.00 handle, while the sellers will want to
see the price breaking below the 140.00 handle to increase the bearish bets
into new lows.
USDJPY Technical
Analysis – 4 hour Timeframe
USDJPY 4 hour
On the 4 hour chart, we can
see that we have a downward trendline defining the current bearish
momentum. The sellers will likely lean on the trendline with a defined risk
above it to position for a break below the 140.00 handle with a better risk to
reward setup. The buyers, on the other hand, will want to see the price
breaking higher to increase the bullish bets into the next major trendline
around the 146.00 handle.
USDJPY Technical
Analysis – 1 hour Timeframe
USDJPY 1 hour
On the 1 hour chart, we can
see that the price bounced from the lower bound of the average daily range for today and it’s now approaching
the resistance
around the 141.70 level. This is where we can expect the sellers to step in
with a defined risk above the level to position for another drop into the
140.20 level. The buyers, on the other hand, will want to see the price
breaking higher to increase the bullish bets into the trendline.
Upcoming
Catalysts
Today we get the US CPI report. Tomorrow, we have the latest US Jobless
Claims figures and the US PPI data. On Friday, we conclude the week with the
University of Michigan Consumer Sentiment report.