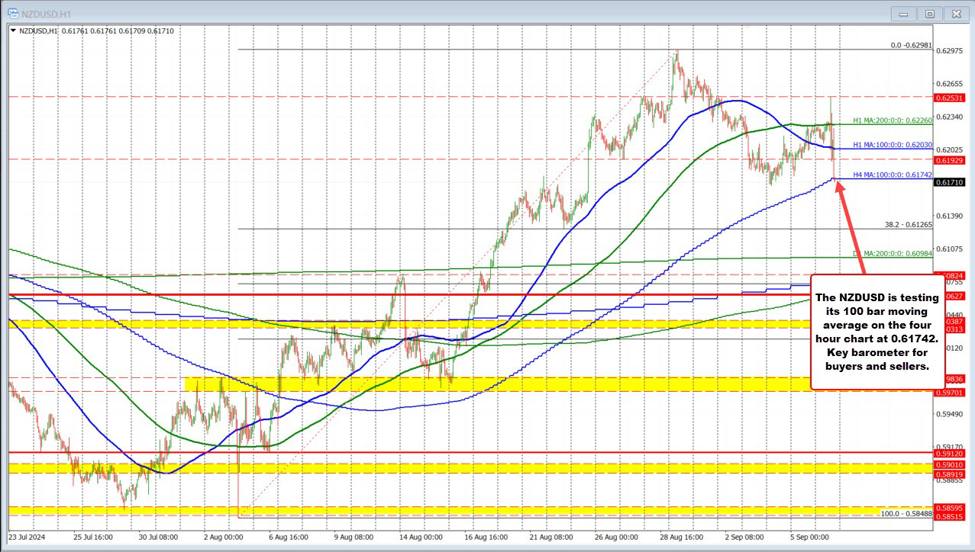
The NZDUSD has moved higher. It is now moving lower in volatile trading as it digests the US jobs report and comments from Fed officials this morning including Feds Waller, Feds Goolsby, and Feds Williams. Stocks are moving lower which is leading to some risk off in the NZDUSD as well.
Technically, the pair is testing its 100-bar moving average on a 4-hour chart. That level comes in at 0.61742. The last time the price traded below that moving average was way back on August 7. A break below the level would have traders looking toward the 38.2% retracement of the August trading range which comes in at 0.61265.
The S&P index is now down -1.67%. The NASDAQ index is down -2.55%, and on pace to its worst trading week going back to January 2022. The NASDAQ index is down -5.73%.
