Fundamental
Overview
Last Friday, Fed Chair
Powell delivered a more dovish than expected speech at the Jackson Hole Symposium as he
basically kept the door open for a 50 bps cut at the September meeting. The
line saying that they will do everything they can to support a strong labour
market was key.
Despite this, the Nasdaq failed to rally sustainably. The culprit could be
related to something that we’ve already seen in the first week of July. In
fact, the Russell 2000 extended the gains into new highs outperforming the
major indexes, which suggests that the lack of follow through from the Nasdaq
could be related to rotation.
Nasdaq
Technical Analysis – Daily Timeframe
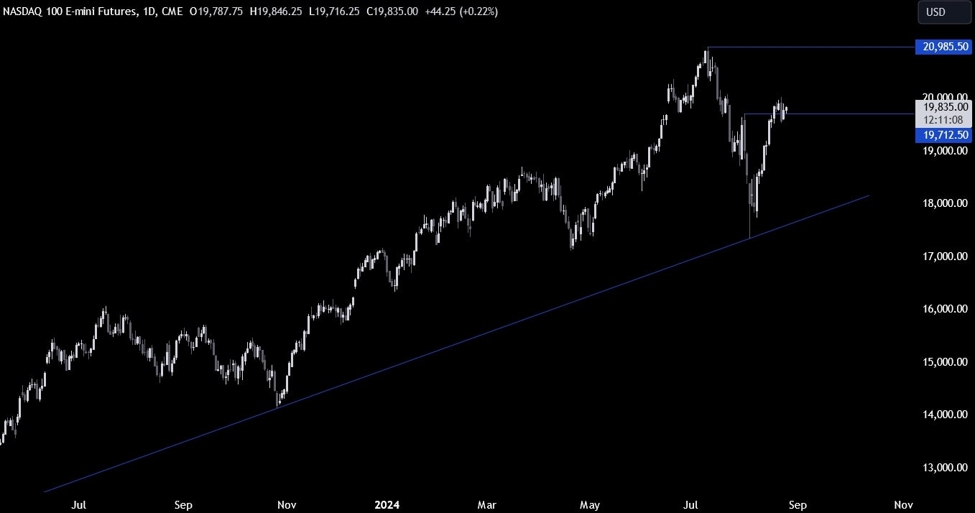
Nasdaq Daily
On the daily chart, we can
see that the Nasdaq broke above the key 19712 level and consolidated just above
it. The buyers remain in control and will certainly target a new all-time high.
The 19700 level is now a support zone and the sellers will need the price to
fall below it to start looking for new lows.
Nasdaq Technical
Analysis – 4 hour Timeframe
Nasdaq 4 hour
On the 4 hour chart, we can
see that we had a quick drop into the 19700 support last Thursday following the
Flash US PMIs where the Manufacturing PMI fell further into contraction and
might have triggered some profit-taking.
The dip-buyers piled in
around the support and near the trendline to position for a rally into new
highs. The sellers will want to see the price breaking below the trendline to
position for a drop into the 18000 level.
Nasdaq Technical
Analysis – 1 hour Timeframe
Nasdaq 1 hour
On the 1 hour chart, we can
see that we have a resistance zone around the 20000 level where the price got
rejected from a couple of times in the past days. The buyers will want to see
the price breaking higher to increase the bullish bets into a new all-time
high, while the sellers will likely lean on it to position for a drop back into
the 17800 support. The red lines define the average daily range for today.
Upcoming Catalysts
Tomorrow we have the US Consumer Confidence report. On Thursday, we get the
latest US Jobless Claims figures. On Friday, we conclude with the US PCE
report.
