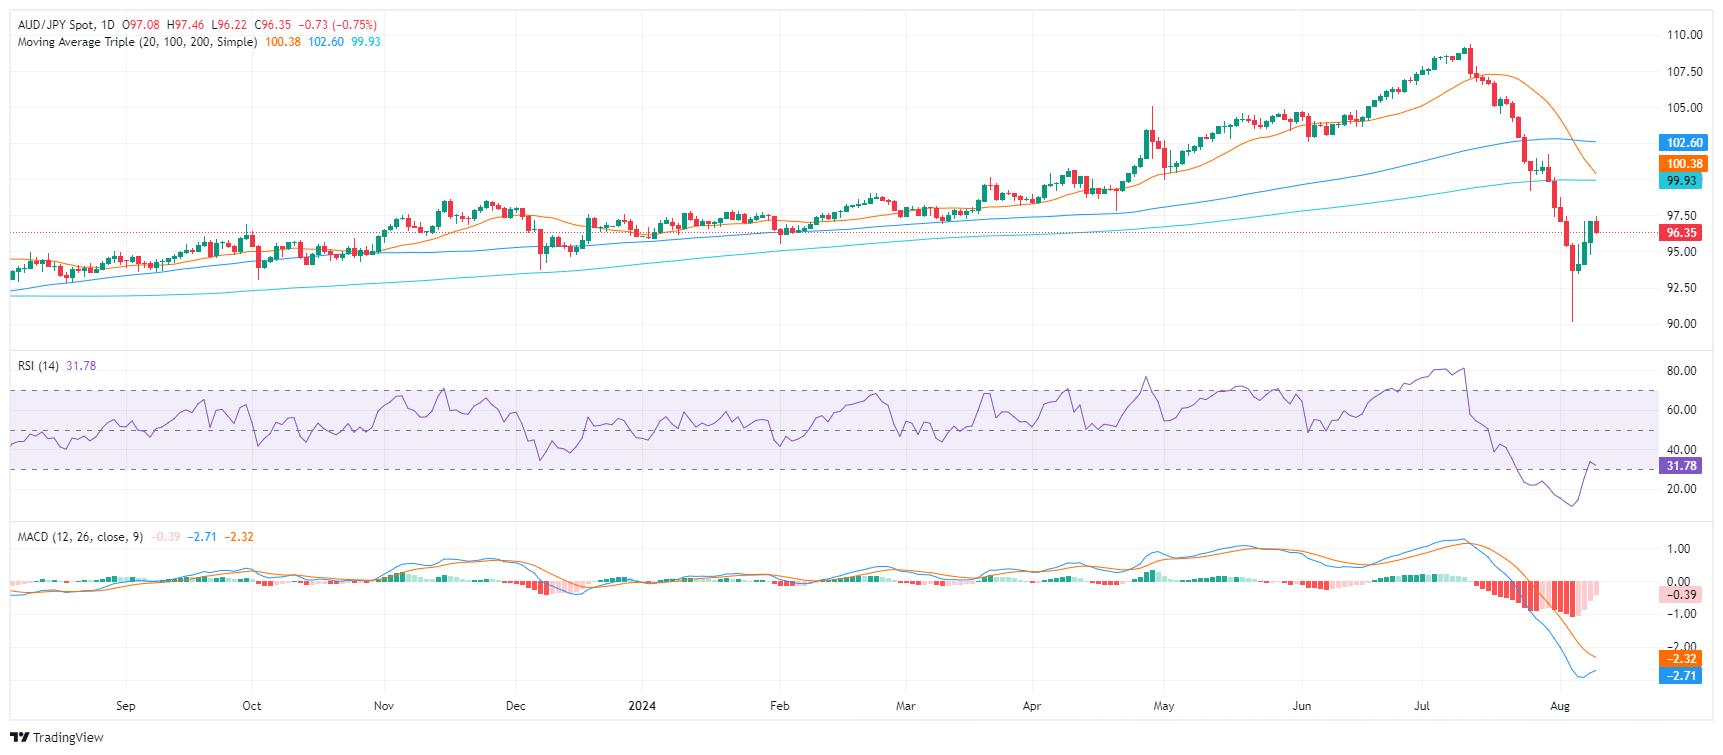
- The AUD/JPY pair declined to 96.45 on Friday resuming the losses after three sessions with gains.
- However, technical indicators suggest a shift towards neutral territory, with the RSI moving out of the oversold zone and the MACD showing decreasing red bars.
- The cross will close a weekly gain of nearly 1% despite the losses.
In Friday’s session, the AUD/JPY pair declined by 0.65% to 96.45, extending its recent downward trajectory. Despite this move lower, technical indicators are showing signs of a potential shift in market sentiment.
The Relative Strength Index (RSI) has moved out of the oversold territory below 30 and is currently hovering around 33. This suggests that the AUD/JPY is no longer considered oversold and is moving towards neutral ground. The Moving Average Convergence Divergence (MACD) is also showing decreasing red bars, indicating that the bearish momentum may be waning.
AUD/JPY daily chart

Based on these technical observations, it is possible that the AUD/JPY pair is entering a consolidation phase. The pair may continue to trade within a range, with limited downside potential due to the increasing support at 96.00 and 95.00. On the upside, resistance at 97.00, 98.00, and 100.00 could limit any significant upward movement.
