
- The Australian Dollar declines following the soft Purchasing Managers Index data release on Monday.
- Australia Composite PMI fell to 49.9 in July from 50.2 in June, with Services PMI decreasing to 50.4 from 51.8.
- The US Dollar lost ground as recent downbeat employment data boosted expectations of a Fed rate cut in September.
The Australian Dollar (AUD) depreciates against the US Dollar (USD) following the release of downbeat Judo Bank Purchasing Managers Index (PMI) data on Monday. Additionally, the AUD receives pressure as the second-quarter inflation data has diminished expectations for another rate hike by the Reserve Bank of Australia (RBA) at its policy meeting on Tuesday.
Markets estimate an RBA rate cut in November, a move anticipated much earlier than previously forecasted for April next year. These factors are contributing to the downward pressure on the Australian Dollar and undermine the AUD/USD pair.
China’s Caixin Services PMI rose to 52.1 in July, from June’s 51.2 reading. The index has exceeded the market expectation of a 51.4 reading. Since both nations are close trade partners, volatility in the Chinese economy can significantly impact the Australian market.
The downside of the AUD/USD pair could be restrained as the US Dollar lost ground after the downbeat US labor market data released on Friday. This has boosted the expectation that the US Federal Reserve (Fed) would cut its interest rate in September.
Daily Digest Market Movers: Australian Dollar declines following the downbeat PMI
- The Judo Bank Australia Composite PMI dropped to 49.9 in July from 50.2 in June, falling below the neutral 50 mark for the first time since January. The Services PMI decreased to 50.4 in July from 51.8 in June. While this represents the sixth consecutive month of expansion in services activity, the growth rate was marginal and the slowest observed in this sequence.
- US Nonfarm Payrolls (NFP) increased by 114K in July from the previous month of 179K (revised down from 206K). This figure came in weaker than the expectation of 175K, data showed on Friday.
- US Average Hourly Earnings eased to 0.2% month-over-month in the same reported period, below the market consensus of 0.3%. On an annual basis, the figure decreased to 3.6% from the previous reading of 3.8%.
- US ISM Manufacturing Purchasing Managers Index (PMI) tumbled to an eight-month low of 46.8 in July, compared to the previous 48.5 reading and the forecasted move up to 48.8.
- China’s Caixin Manufacturing Purchasing Managers Index (PMI) posted a reading of 49.8 for July, falling short of the expected reading of 51.5 and the previous reading of 51.8.
- The Australian Bureau of Statistics (ABS) reported a trade surplus of 5,589 million for June, surpassing the anticipated 5,000 million but still below the previous reading of 5,773 million.
- During a press conference, Federal Reserve Chair Jerome Powell stated that a rate cut in September is “on the table.” According to Reuters, Powell added that the central bank will closely monitor the labor market and remain vigilant for signs of a potential sharp downturn.
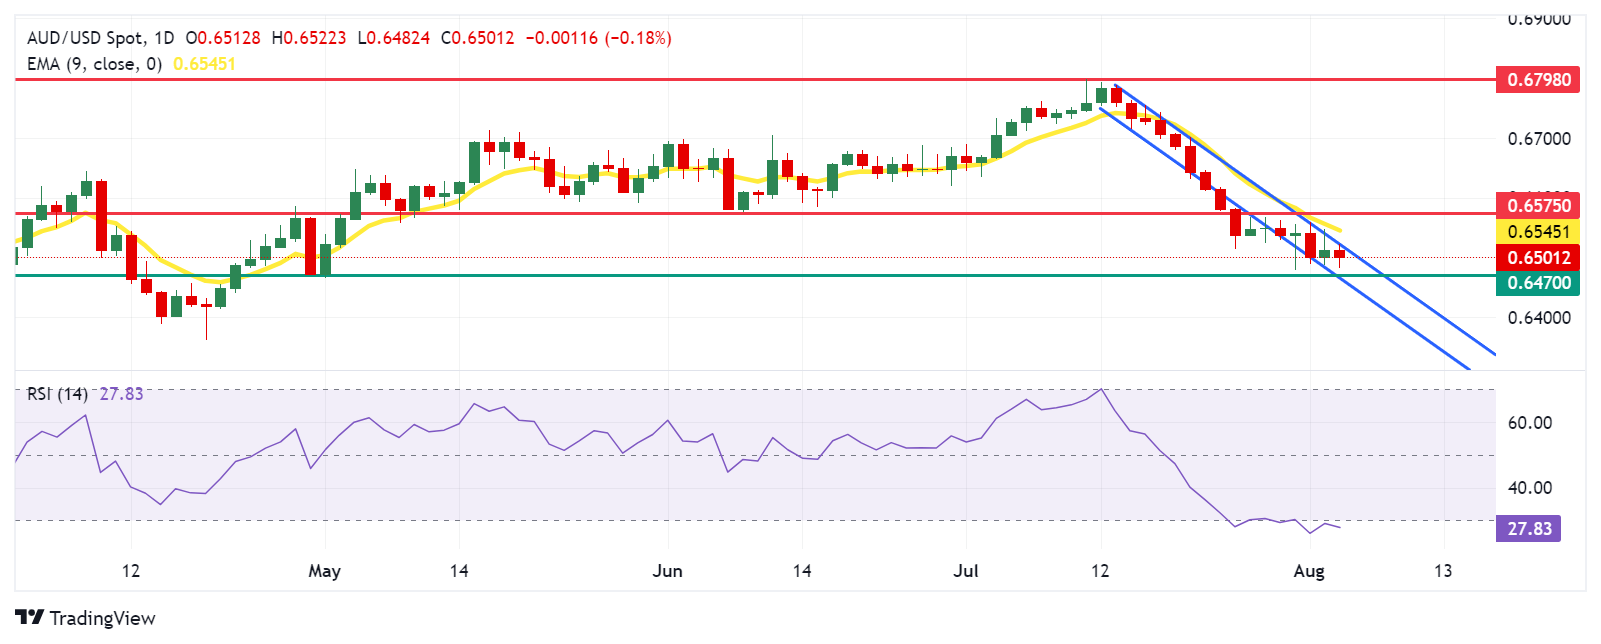
Technical Analysis: Australian Dollar hovers around 0.6500
The Australian Dollar trades around 0.6500 on Monday. The daily chart analysis shows that the AUD/USD pair consolidates within a descending channel, indicating a bearish bias. The 14-day Relative Strength Index (RSI) is hovering below the oversold 30 level, which suggests a potential for an upward correction.
The AUD/USD pair could find immediate support around the lower boundary of the descending channel at the throwback support of 0.6470 level.
On the upside, resistance is first encountered at the channel’s upper boundary, around 0.6520, followed by the nine-day Exponential Moving Average (EMA) at 0.6544. The next significant resistance is at 0.6575, where the “throwback support turned resistance” is located. A breakout above this level could propel the AUD/USD pair toward a six-month high of 0.6798.
AUD/USD: Daily Chart
Australian Dollar PRICE Today
The table below shows the percentage change of Australian Dollar (AUD) against listed major currencies today. Australian Dollar was the weakest against the Japanese Yen.
| USD | EUR | GBP | JPY | CAD | AUD | NZD | CHF | |
|---|---|---|---|---|---|---|---|---|
| USD | -0.08% | 0.08% | -0.96% | -0.01% | 0.18% | 0.05% | -0.41% | |
| EUR | 0.08% | 0.08% | -1.00% | -0.06% | 0.27% | 0.02% | -0.44% | |
| GBP | -0.08% | -0.08% | -1.02% | -0.12% | 0.20% | -0.06% | -0.51% | |
| JPY | 0.96% | 1.00% | 1.02% | 0.97% | 1.09% | 1.02% | 0.57% | |
| CAD | 0.00% | 0.06% | 0.12% | -0.97% | 0.24% | 0.07% | -0.57% | |
| AUD | -0.18% | -0.27% | -0.20% | -1.09% | -0.24% | -0.26% | -0.71% | |
| NZD | -0.05% | -0.02% | 0.06% | -1.02% | -0.07% | 0.26% | -0.46% | |
| CHF | 0.41% | 0.44% | 0.51% | -0.57% | 0.57% | 0.71% | 0.46% |
The heat map shows percentage changes of major currencies against each other. The base currency is picked from the left column, while the quote currency is picked from the top row. For example, if you pick the Australian Dollar from the left column and move along the horizontal line to the US Dollar, the percentage change displayed in the box will represent AUD (base)/USD (quote).
Economic Indicator
Judo Bank Composite PMI
The Composite Purchasing Managers Index (PMI), released on a monthly basis by Judo Bank and S&P Global, is a leading indicator gauging private-business activity in Australia for both the manufacturing and services sectors. The data is derived from surveys to senior executives. Each response is weighted according to the size of the company and its contribution to total manufacturing or services output accounted for by the sub-sector to which that company belongs. Survey responses reflect the change, if any, in the current month compared to the previous month and can anticipate changing trends in official data series such as Gross Domestic Product (GDP), industrial production, employment and inflation. The index varies between 0 and 100, with levels of 50.0 signaling no change over the previous month. A reading above 50 indicates that the Australian private economy is generally expanding, a bullish sign for the Australian Dollar (AUD). Meanwhile, a reading below 50 signals that activity is generally declining, which is seen as bearish for AUD.
Last release: Sun Aug 04, 2024 23:00
Frequency: Monthly
Actual: 49.9
Consensus: –
Previous: 50.2
Source: S&P Global