The old adage is that if the US catches a cold, Canada gets the flu.
The market is certainly sending warning signals about the US economy as yields plunge but USD/CAD hasn’t made a decisive move yet. But that moment might not be far off as the pair threatens a trio of highs from the past two years.
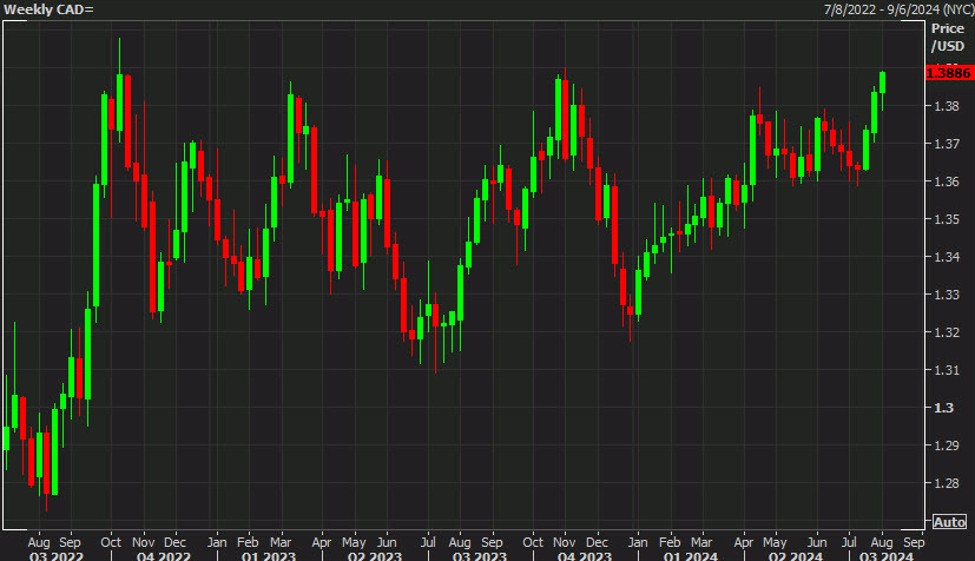
USD/CAD weekly chart
The prior highs were:
- October 2022: 1.3977
- March 2023: 1.3861
- November 2023: 1.3899
Currently, the pair is trading at 1.3884, up 76 pips on the day. Oftentimes the US and Canadian jobs reports are released simultaneously but that won’t be the case on Friday, with the Canadian report not due for another week.
In terms of rate pricing, Fed pricing is for 83 bps through year end while BOC pricing is 63 bps. That seems out of line to me, because if the Fed cuts that aggressively, the Bank of Canada will be right there.
As for the upside in this pair, I would look for 1.42 and then 1.44 if those highs break.