Fundamental
Overview
Crude oil has been under
sustained pressure since the beginning of July. Things got even worse as
Trump’s odds of winning soared after the failed assassination attempt. He is a
great supporter of the “drill, baby, drill” slogan and he will likely put an
end to the war in Ukraine if he gets elected.
Those should be bearish
drivers for crude oil as expectations of increased supply could give the buyers
a hard time for new cycle highs. On the macro side, we haven’t seen much change,
on the contrary, the latest US data continue to show a resilient economy with even
some pickup.
So, we now have some bearish
drivers on the supply side but bullish drivers on the demand side. Overall, it
shouldn’t give conviction for huge moves on either side and the market will
likely continue to trade in a range.
Crude Oil
Technical Analysis – Daily Timeframe
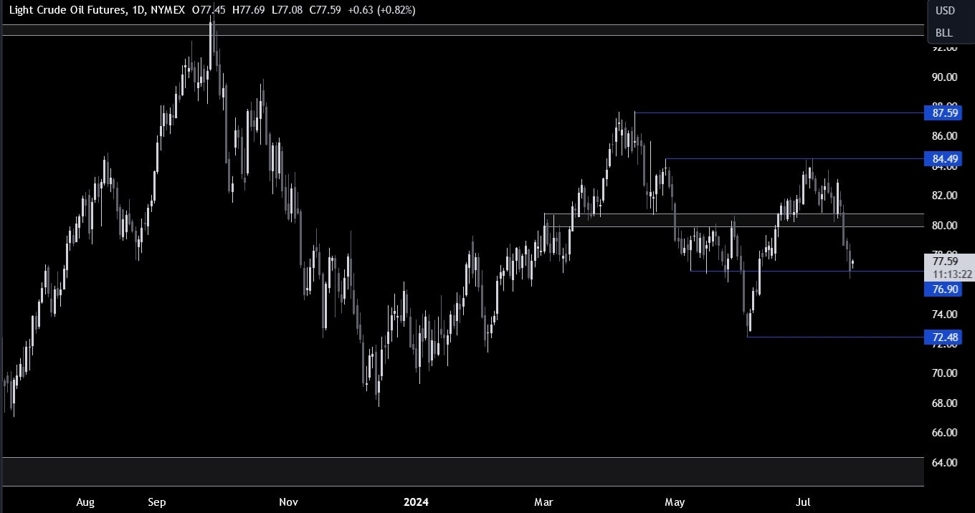
Crude Oil Daily
On the daily chart, we can
see that crude oil broke through the key 80 support zone and extended the drop into the 77 level
as the sellers piled in more aggressively while the buyers folded.
We can
expect the buyers to step back in around this level with a defined risk below
it to position for a rally back into the key 80 level. The sellers, on the
other hand, will want to see the price breaking lower to increase the bearish
bets into the 72.50 level next.
Crude Oil Technical
Analysis – 4 hour Timeframe
Crude Oil 4 hour
On the 4 hour chart, we can
see that we have a strong support around the 77 level as we can also find the 61.8%
Fibonacci retracement level for confluence. We have also a minor downward trendline
defining the current bearish momentum.
If the price were to break
higher, the buyers should gain some more confidence and increase the bullish
bets into the 80 level. The sellers, on the other hand, will likely keep on
leaning on the trendline to position for a break below the 77 support.
Crude Oil Technical Analysis – 1 hour Timeframe
Crude Oil 1 hour
On the 1 hour chart, we can
see that the price is now around the trendline. This is where the sellers will
look for a rejection and a drop into new lows, while the buyers will look for a
breakout to the upside. The red lines define the average daily range for today.
Upcoming
Catalysts
Today we have the US Flash PMIs. Tomorrow, we will get the latest US Jobless
Claims figures. Finally, on Friday we conclude the week with the US PCE report.
