- NZD/USD trudges below the 0.6070 level, marking its worst week since January.
- The pair closed at 0.6010, indicating a weekly loss of approximately 1.80%.
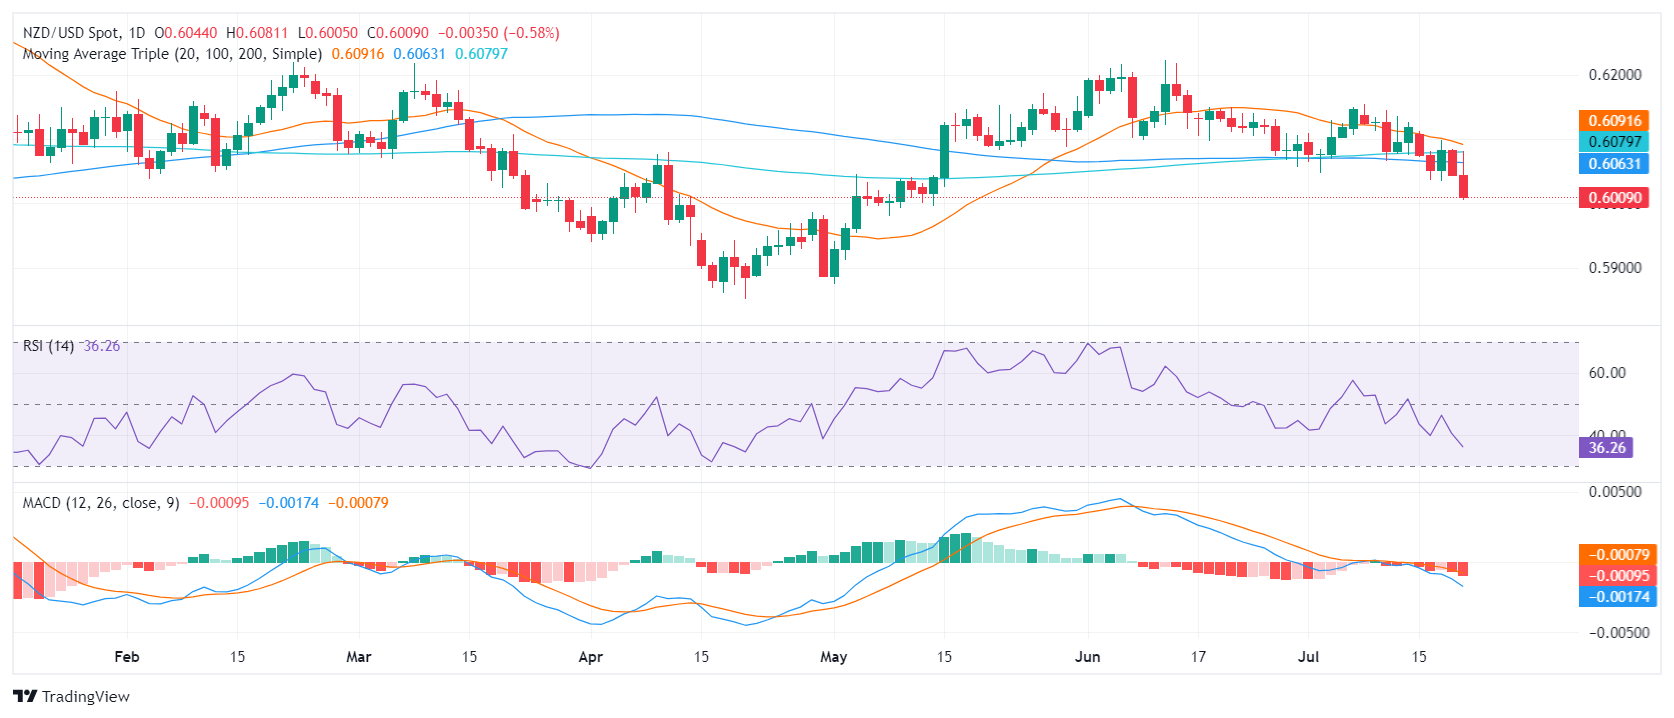
- NZD/USD remains under the key SMA of 20, 100, and 200 days, pointing to a sustained bearish bias.
In Friday’s session, the NZD/USD sustained its downward momentum, dropping by 0.65% to touch 0.6010. The pair’s failure to reclaim the 0.6070 level resulted in a dip to the significant 0.6000 line, consequently closing its worst week since the start of the year with a weekly loss of around 1.80%.
The daily technical indicators also echo this downward trend. The Relative Strength Index (RSI) has decreased further to 36 signaling a continuation of selling pressure. Additionally, the Moving Average Convergence Divergence (MACD) continues to print rising red bars, reaffirming the growing bearish sentiment.
NZD/USD daily chart

Resistance presently resides at the former support level of 0.6070 and then around 0.6100. On the other hand, strong support is now observed at the formidable 0.6000 line, under which the 0.6450-0.6470 range is visible. Should the bearish tilt maintain its course and lead to a further downturn beneath these levels, it would solidify the bearish narrative.
