Fundamental
Overview
Yesterday, we got some goldilocks data as the US CPI report came in on the
softer side and the US
Jobless Claims remained stable. Despite this, the Nasdaq sold off and erased
all the gains from the US NFP report.
The culprit seemed to be rotation being driven by hedge funds facing short
squeeze on their small cap hedges as yields come down, noted Bob Elliott CIO at
Unlimited Funds. In fact, the Russell 2000 displayed an opposite price action
with the index having its biggest daily performance against the Nasdaq on
record.
This is generally very short-term stuff, so it wouldn’t be surprising to
see the Nasdaq going back to its usual upward trend today.
Nasdaq
Technical Analysis – Daily Timeframe
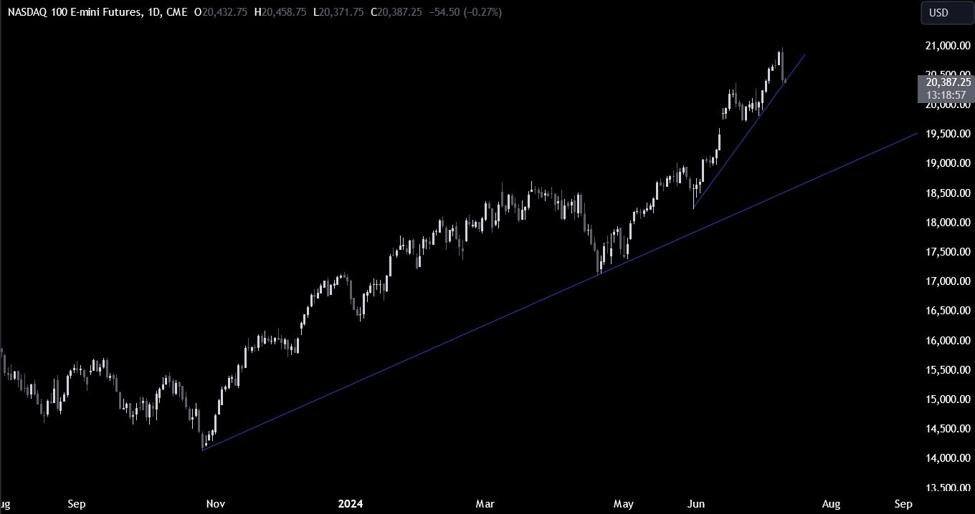
Nasdaq Daily
On the daily chart, we can
see that the Nasdaq has a pretty bad day yesterday following the US CPI release.
The price is now testing a key daily trendline around the 20390 level. This is
where we can expect the buyers piling back in with a defined risk below the
trendline to position for a rally into a new all-time high. The sellers, on the
other hand, will want to see the price breaking lower to increase the bearish
bets into the 19730 level next.
Nasdaq Technical Analysis – 4 hour Timeframe
Nasdaq 4 hour
On the 4 hour chart, we can
see that we have a strong support zone around the 20390 level where we can find
the confluence
of the trendline, the previous resistance
now turned support and the 50% Fibonacci
retracement level. The buyers should lean on this support, while the
sellers will want to see it breaking.
Nasdaq Technical
Analysis – 1 hour Timeframe
Nasdaq 1 hour
On the 1 hour chart, we can
see that we have some minor consolidation right at the support zone. If the
price were to break above the 20500 level, we will likely see the bullish momentum
increasing as the buyers will likely pile in with more conviction. The red
lines define the average daily range for today.
Upcoming Catalysts
Today we conclude the week with the US PPI and the University of Michigan
Consumer Sentiment survey.
