The NZDUSD rallied toward the end of last week’s trading, after sellers had their shot on the break of both the 100/200 day MAs earlier in the week. The move higher initially extended to the 200 bar MA on the 4-hour chart, before correcting lower midweek.
On Friday, buyers returned after the US jobs report and extended above the 200 bar MA on the 4-hour chart.
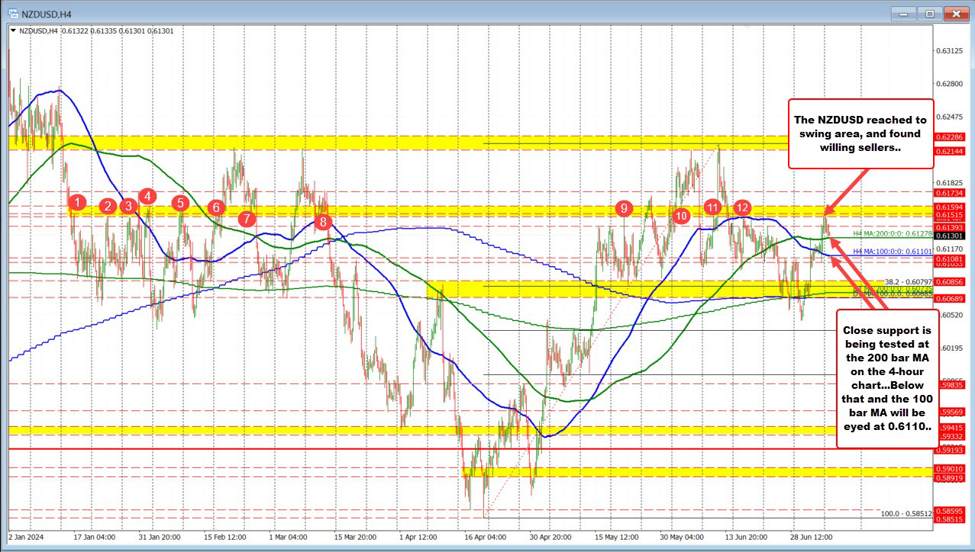
Today, the price extended to the highest level since June 14th and in the process moved into a swing area target between 0.6151 to 0.6159. Sellers leaned in the Asian session and rotated lower. The low price has reached back to the 200-bar MA on the 4-hour at 0.61278.
So resistance at the topside swing area stalled the rally. The 200 bear MA on the 4-hour chart is stalling the fall. Those levels (up to 0.6159 and down to 0.6127) are the close break points going forward.
Hear all about it, in the above video.