Fundamental
Overview
The USD continues to be
backed by good economic data as we have also seen recently from the US PMIs last Friday and the US Consumer Confidence report this week. Although such
data keeps the interest rates expectations stable around two cuts by the end of
the year, it should also support the risk sentiment amid a pickup in growth.
This could be a headwind for the greenback.
The EUR, on the other hand,
has been under pressure due to some US Dollar strength this week. It looks like
the price action is being influenced more by month-end, quarter-end and half
year-end flows rather than something fundamental. We had also a key breakout in
USDJPY yesterday and flows there might have spilled over to other major pairs.
EURUSD Technical
Analysis – Daily Timeframe
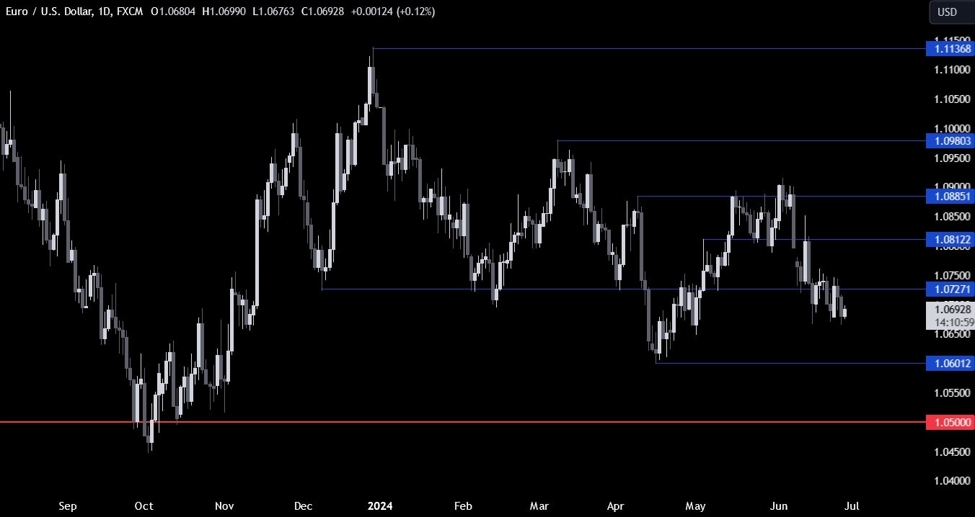
EURUSD Daily
On the daily chart, we can
see that EURUSD has been ranging just beneath the key 1.0727 level. As the
price stays below the level, it skews the bias more to the downside as the
sellers continue to pile in for a drop into the 1.06 handle. The buyers will want
to see the price rallying back above the 1.0727 level to regain some control
and start targeting new highs.
EURUSD Technical
Analysis – 4 hour Timeframe
EURUSD 4 hour
On the 4 hour chart, we can
see that we have a strong support around the 1.0680 level where the price got
rejected from several times in the past days. We can also see that the price
has been printing lower highs as the market kept testing the support. This is a
bearish price action and it also formed what looks like a descending
triangle.
A breakout to the downside
should see the bearish momentum increasing with the sellers piling in for a
drop into the 1.06 handle. The buyers, on the other hand, will want to see a
breakout to the upside to invalidate the bearish setup and position for a rally
into the 1.08 handle.
EURUSD Technical
Analysis – 1 hour Timeframe
EURUSD 1 hour
On the 1 hour chart, we can
see that we have an interesting resistance zone around the 1.07 handle as the
price reacted to it several times. A break above it should see the buyers
extending the bounce from the 1.0670 support into the 1.0727 resistance. The
sellers, on the other hand, might lean on it to position for a break below the
support with a better risk to reward setup. The red lines define the average daily range for today.
Upcoming
Catalysts
Today we get the latest US Jobless Claims figures, while tomorrow we conclude
the week with the US PCE report.