Fundamental
Overview
This was a messy week for many markets, including gold. After some up and
downs, we are ending the week basically flat. There was no real change in the
fundamentals this week as the data just showed some more rebalancing in the US
labour market but didn’t signal any material weakness.
As of now, it looks like gold have limited downside but lots of upside as
inflation abates slowly while risks to the growth picture increase the longer
the Fed keeps policy restrictive. In the short-term, strong US data might weigh
a bit on the market, but in the long-term weak data is likely to trigger bigger
upside moves.
Gold
Technical Analysis – Daily Timeframe
Gold Daily
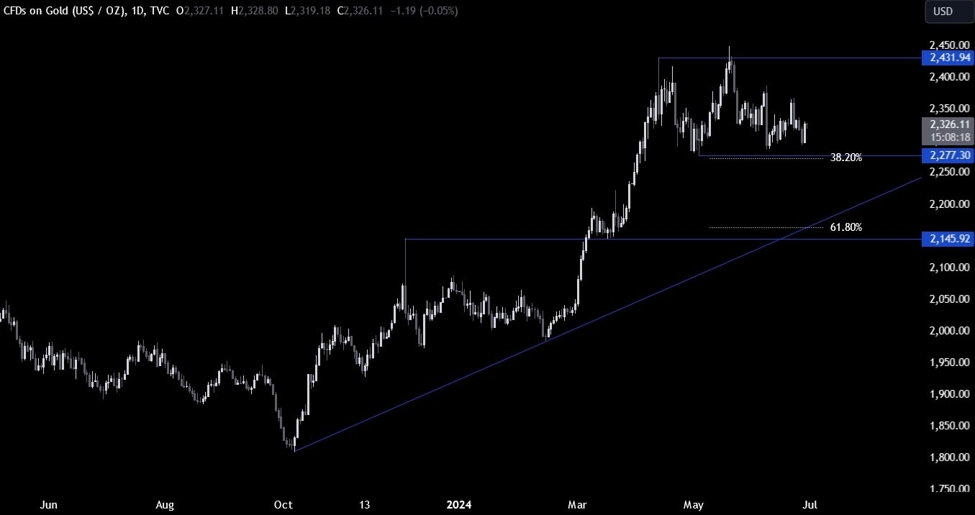
On the daily chart, we can
see that gold has been mostly rangebound although the market maintains a
bullish bias. From a risk management perspective, the buyers will have a better
risk to reward setup around the key 2277 support zone where we can also find the 38.2% Fibonacci retracement level for confluence.
The sellers, on the other
hand, will want to see the price breaking below the support to change the bias
and increase the bearish bets into the next support around the major trendline where we can also find the 61.8% Fibonacci
retracement level for confluence.
Gold Technical Analysis
– 4 hour Timeframe
Gold 4 hour
On the 4 hour chart, we can
see more clearly the rangebound price action around the 2325 zone. We got
another quick drop recently, but the price eventually erased the losses and
came back to the 2325 area.
The buyers will want to see
the price breaking above the recent swing high at 2337 to gain more conviction
and position for a rally into the 2387 level next. The sellers, on the other
hand, will likely continue to pile in around these levels to position for a
drop into the 2277 support targeting a break below it.
Gold Technical Analysis
– 1 hour Timeframe
Gold 4 hour
On the 1 hour chart, we can
see the messy price action of the past few weeks as the market awaits a
catalyst to get things going. A break below the 2318 level could see the market
extending the drop towards the 2277 support. The red lines define the average daily range for today.
Upcoming
Catalysts
Today we conclude the week with the US PCE report where the market expects
the Core PCE to fall further towards the Fed’s 2% target.

 This “NEW CONCEPT” Trading Strategy Prints Money!… (INSANE Results!)
 breakout perfect entry #forex #crypto #trading #trending