Fundamental
Overview
We got a bit of a pullback in the S&P 500 in the last few days. If we
were to try to find a catalyst, the second miss in a row in the US
Jobless Claims last Thursday could be it, but the data was still pretty
good and not worrying in the grand scheme of things. In fact, the US
PMIs last Friday showed a pretty good pickup in growth without inflationary
pressures. That should be good news for the market and the risk sentiment in
general.
The index was dragged down mainly because of tech weakness with Nvidia
extending the correction to 16% from the all-time high (it’s positive in
pre-market trading at the moment). If we look at the other markets, the Russell
2000 and the Dow were up and growth sensitive sectors like Industrials and
Financials have been positive. Also keep in mind that it’s quarter-end which could skew the price action. Overall, it just looks like a healthy pullback.
S&P 500
Technical Analysis – Daily Timeframe
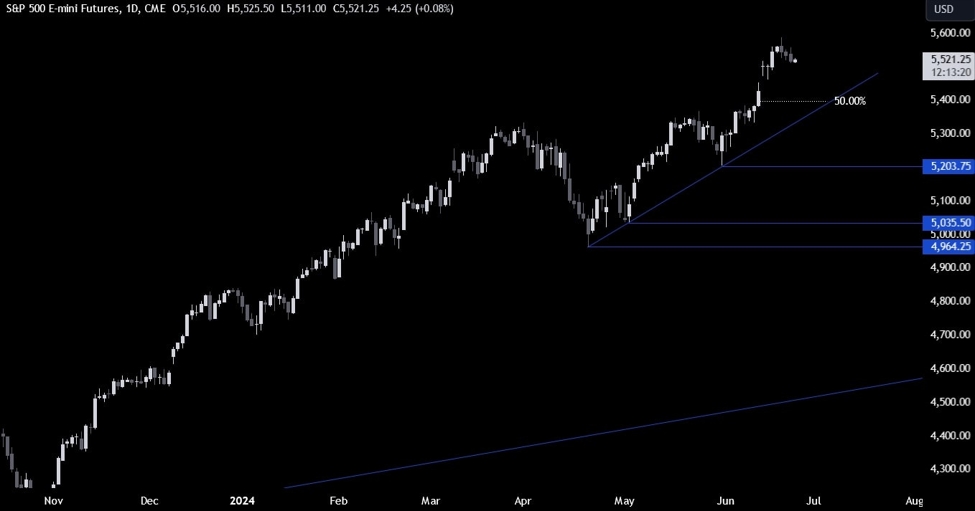
S&P 500 Daily
On the daily chart, we can
see that we got a bit of a pullback in the S&P 500 in the last few days. From
a risk management perspective, the buyers will have a better risk to reward
setup around the trendline where they will also find the confluence of the 50% Fibonacci retracement level. At the moment though, it’s hard
to envision such a big pullback unless we get some really ugly US data.
S&P 500 Technical
Analysis – 4 hour Timeframe
S&P 500 4 hour
On the 4 hour chart, we can
see that the price is testing the minor trendline around the 5510 level. This
is where we can expect the buyers stepping in with a defined risk below the
trendline to position for a rally into a new all-time high. The sellers, on the
other hand, will want to see the price breaking lower to increase the bearish momentum
and position for a drop into the major trendline around the 5360 level.
S&P 500 Technical
Analysis – 1 hour Timeframe
S&P 500 1 hour
On the 1 hour chart, we can
see that we have a good support
around the 5510 level adding some further confluence to the trendline which
should technically strengthen the support zone. The buyers will then need to
break above the 5555 resistance to gain more conviction and increase the
bullish bets into new highs. The red lines define the average daily range for today.
Upcoming
Catalysts
Today we have the US Consumer Confidence report where the market will be
focused on the labour market details. On Thursday, we get the latest US Jobless
Claims figures, while on Friday we conclude the week with the US PCE.