GBPUSD sellers are making a play
The GBPUSD fell earlier today. The BOE kept their policy rate unchanged today. However, as Justin pointed out in his posts after the decision, the Bank of England’s latest statement includes subtle dovish hints suggesting potential rate cuts in the near future. In the forward guidance, the BOE added, “As part of the August forecast round, members of the Committee will consider all of the information available and how this affects the assessment that the risks from inflation persistence are receding.” This points to the possibility of a rate cut in August if current data trends continue.
Additionally, the BOE is already finding excuses to dismiss the stubbornly high services inflation. They stated, “The upside news in services price inflation relative to the May Report did not alter significantly the disinflationary trajectory that the economy was on. This view was supported by evidence that the recent strength in services inflation included regulated and indexed components of the basket, and volatile components. Such factors would not push up medium-term inflation.” The fact that the policy decision was “finely balanced” indicates that policymakers are giving significant thought to the next step, potentially setting the stage for rate cuts
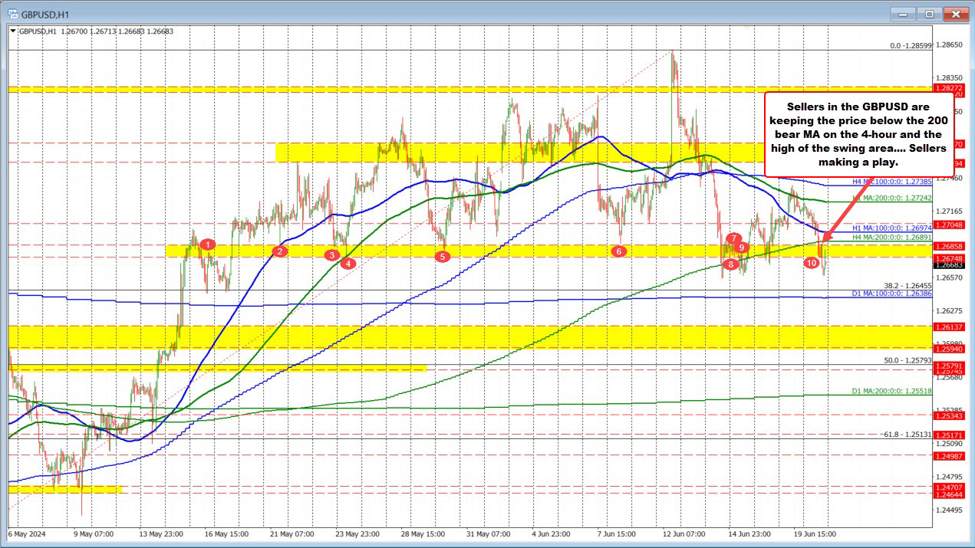
Technically, the price fell below both the 100-hour moving average at 1.2697, and its 200-bar MA on the 4-hour chart currently at 1.26891. The price also fell below a swing area (red numbered circles) between 1.26748 and 1.26858.
Sellers are making a play below those levels.
Going forward, if the price can stay below the swing area/200 bar MA at 1.26858 to 1.26891, the sellers can push lower (that is the close risk given the break lower today).
Now ….those level were broken on Friday, on Monday, and also Tuesday and each time the breaks failed. Today is the 4th time below those levels. So sellers already had their shot and each time they missed.
However, is this the one that makes a run toward the 100-day MA at 1.26386 and then have traders see what happens near that level? That is the play, given the break today and for traders who are more bearish now..
If the 100-day MA can be broken (it would also move below the 38.2% of the move up from April), traders would look toward the 50% of the same move higher at 1.25793 and the 200 day MA at 1.25518.
