S&P tests dual support level
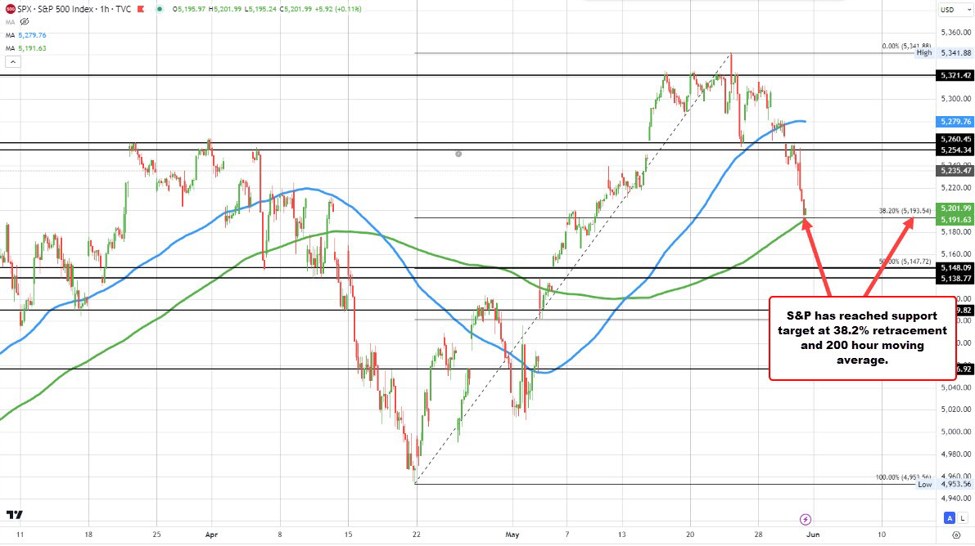
The US stocks continued their decline with the S&P index now down -33.74 points at 5201.92.
The low price extended to 5191.68, and in the process tested key support defined by its 200-hour moving average at 5191.63 currently (green line on the chart below) and the 38.2% retracement of the move up from the April 19 below. That level comes in at 5193.54.
So far the support level has done a good job of stalling the fall.
Key dual technical level for both buyers and sellers. Staying above is more bullish. Moving below would add to the bearish bias.
This article was originally published by Forexlive.com. Read the original article here.
 RULE-BASED Pocket Option Strategy That Actually Works | Live Trading
