CVX Elliott Wave Analysis Trading Lounge Daily Chart,
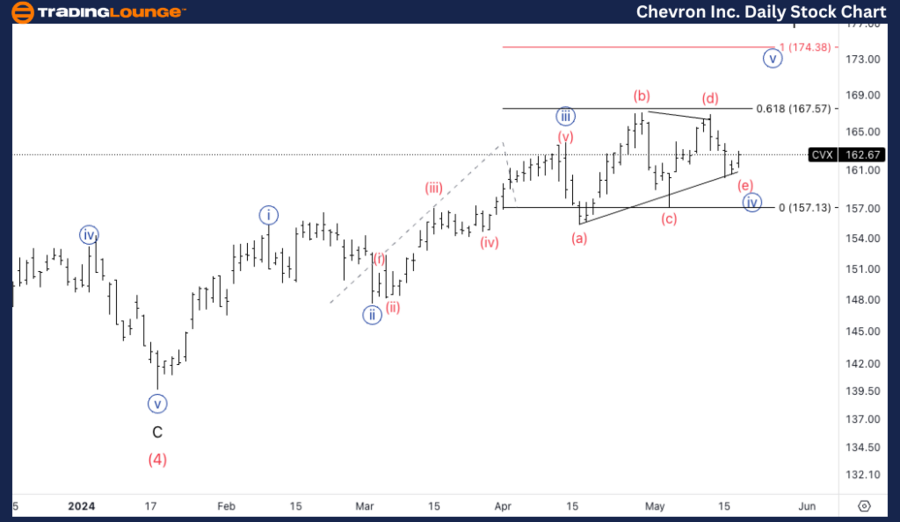
Chevron Inc., (CVX) Daily Chart.
CVX Elliott Wave technical analysis
Function: Trend.
Mode: Impulsive.
Structure: Motive.
Position: Minor wave 1.
Direction: Upside in Minute {v}.
Details: Looking for a top in Minor wave 1, to ideally break previous wave B top at 171$ to give us additional upside confirmation.
CVX Elliott Wave Analysis Trading Lounge 4Hr Chart,
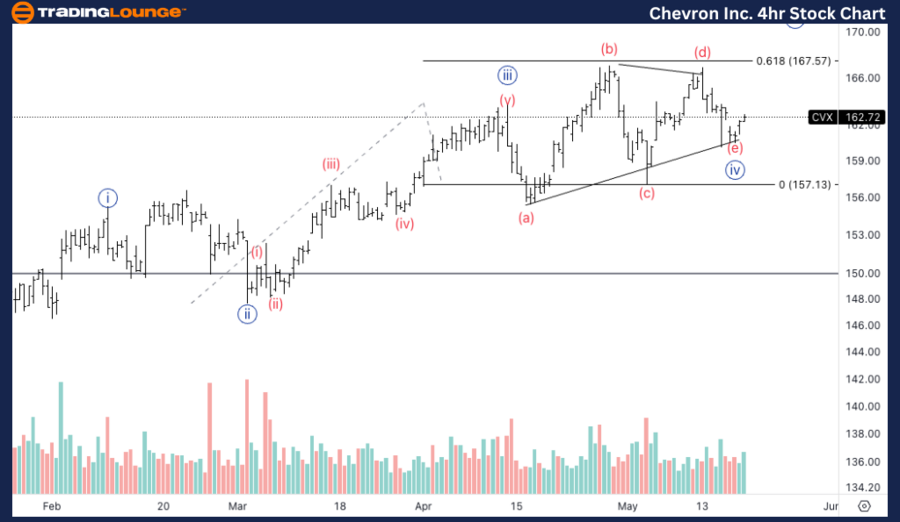
Chevron Inc., (CVX) 4Hr Chart.
CVX Elliott Wave technical analysis
Function: Trend.
Mode: Impulsive.
Structure: Motive.
Position: Wave (e) of {iv}.
Direction: Upside in wave (i) of {v}.
Details: Looking for the potential triangle in wave {iv} to be completed and look for upside resumption.
Explore the latest Elliott Wave analysis for Chevron (CVX) as of May 20, 2024. Discover key support and resistance levels and potential price targets for CVX stock.
ETN Elliott Wave technical analysis – Daily chart
Chevron (CVX) is currently in the final stages of Minor wave 1, with an expected top in Minute wave {v}. We are looking for a break above the previous wave B top at $171, which would provide additional confirmation of further upside potential.
ETN Elliott Wave technical analysis – Four hour chart
On the 4-hour chart, CVX appears to be completing a potential triangle formation in wave {iv}. Once this triangle is completed, we expect an upside resumption in wave (i) of {v}.
Technical analyst: Alessio Barretta.


 #optionbuying #optionstrading#trading#nifty #scalping #sharemarket #shorts #ytshorts