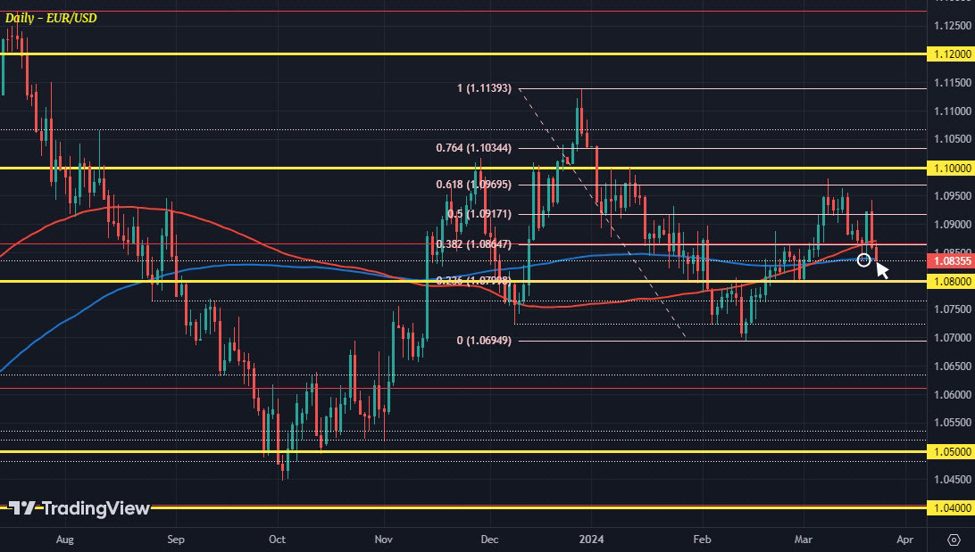
The market reaction to the post-Fed reaction seems to be “oops, we might have overreacted”. The dollar stormed back in trading yesterday and has completely erased the drop on Wednesday. What’s more is that the greenback is now threatening some key technical levels on the charts. Let’s get straight into that.
EUR/USD daily chart
For one, EUR/USD is now back down to test its 200-day moving average (blue line) at 1.0838 again. The key level is what helped to arrest the drop from earlier this week and is now challenged once more. A break below that will see sellers exert more downside control and look towards 1.0800 next. Keep above and buyers will still have some room to work with going into next week.
GBP/USD daily chart
The BOE did not surprise yesterday as they left rates unchanged and stuck to a similar guidance in February. Yet, markets are of the view that there are dovish elements at play. The only thing I can point to was the change in bank rate votes, whereby Haskel and Mann no longer stuck to their hawkish dissents last month.
In any case, that seems to be enough to weigh down the pound yesterday as the dollar also held more resilient.
The fall in GBP/USD now sees the pair close in on a test of its 100-day moving average (red line) next. The key level is seen at 1.2630 and will be an important technical support layer for buyers to defend. Adding to that will be the 200-day moving average (blue line) seen nearby at 1.2593 currently.
That makes the region around 1.2593-30 a particular important one at the moment. For buyers, keep above that and they will have some supportive platform to work with. But if price does break below that, sellers will be in control and look towards the 1.2500 mark next.
USD/JPY weekly chart
The last key chart in play at the moment is of course none other than USD/JPY. The pair has surged higher after the BOJ decision earlier this week initially. And with the dollar being more resilient, it is keeping near the highs of the week at 151.55 now.
Some verbal intervention from Tokyo did help to nudge the pair down from a high of 151.86 earlier. But it is clear that the upside pressures are building as traders shun the BOJ decision to end negative rates.
The 2022 and 2023 highs around 151.90-94 is still the key resistance level to watch at the moment. If buyers can break through that, it will be clear skies until Tokyo decides to be more forceful to rein in the upside momentum next.
Overall, the three charts above are pointing to a somewhat similar mood board or sentiment. And that is the dollar is looking to make more headway in trading this week, despite its initial setback. So, be sure to keep a close watch on the technicals as we look to wrap up the week. They will be the best gauge in determining whether this bout of dollar resilience has legs to run.
