GBPUSD moved up to the 100 bar MA on 4-hour chart
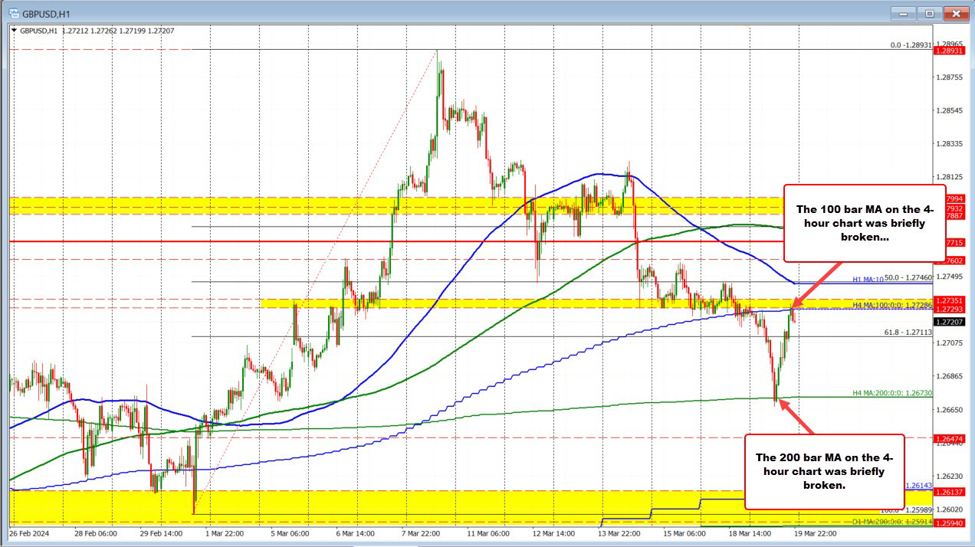
The GBPUSD has completed its down and up “lap” that saw the pair move from an Asian session high at 1.27305, to a low in the European session at 1.2667 (and briefly below the 200 bar MA on the 4-hour chart at 1.2673), and then back up to a US session high at 1.2732. The current price is trading at 1.27207.
That the new session high, the price did extend above the 100-bar moving average on a 4.-hour chart currently at 1.27286. So like at session lows, the price will move the 4-hour moving average by a few pips only to fail.
So sellers had their shot. The buyers had their shot. They both missed but you can also say the support and resistance did a pretty good job of doing their job.
This article was originally published by Forexlive.com. Read the original article here.