- GBP/USD lacked momentum on Tuesday.
- US data missed the mark, traders await US GDP.
- US PCE inflation also due this week for Fed watchers.
GBP/USD cycled around 1.2680 on Tuesday as markets look for a fresh push from the Federal Reserve (Fed) with investors steadily pushing away from elevated rate cut bets. US Gross Domestic Product (GDP) and Personal Consumption Expenditure Price Index (PCE) inflation numbers are due this week.
UK data remains thin this week, and markets are focusing on key figures to update rate cut expectations from the Fed.
US Durable Goods Orders declined more than expected in January, printing at -6.1% versus the expected -4.5%. December’s Durable Goods Orders were revised to -0.3% from 0.0%.
US annualized GDP for the fourth quarter will print on Wednesday and is expected to print flat, holding at the previous 3.3% for the year ended in Q4. US Core PCE Price Index inflation, slated for Thursday, is expected to tick down for the annualized figure to 2.8% from 2.9%, while the MoM figure is expected to heat up in January to 0.4% from the previous 0.2%.
As the Fed’s favored inflation measure, PCE will draw plenty of investor’s eyes as they hope for signs of rate cuts from the US central bank. A too-tight labor market, a stubborn “last mile” on inflation, and a domestic US economy that refuses to slip into a recession have weighed on trader hopes for a Fed rate trim.
According to the CME’s FedWatch Tool, money markets are expecting around 75 basis points in rate cuts through 2024, bringing rate expectations in line with the Fed’s own projections for the first time since late 2023.
GBP/USD technical outlook
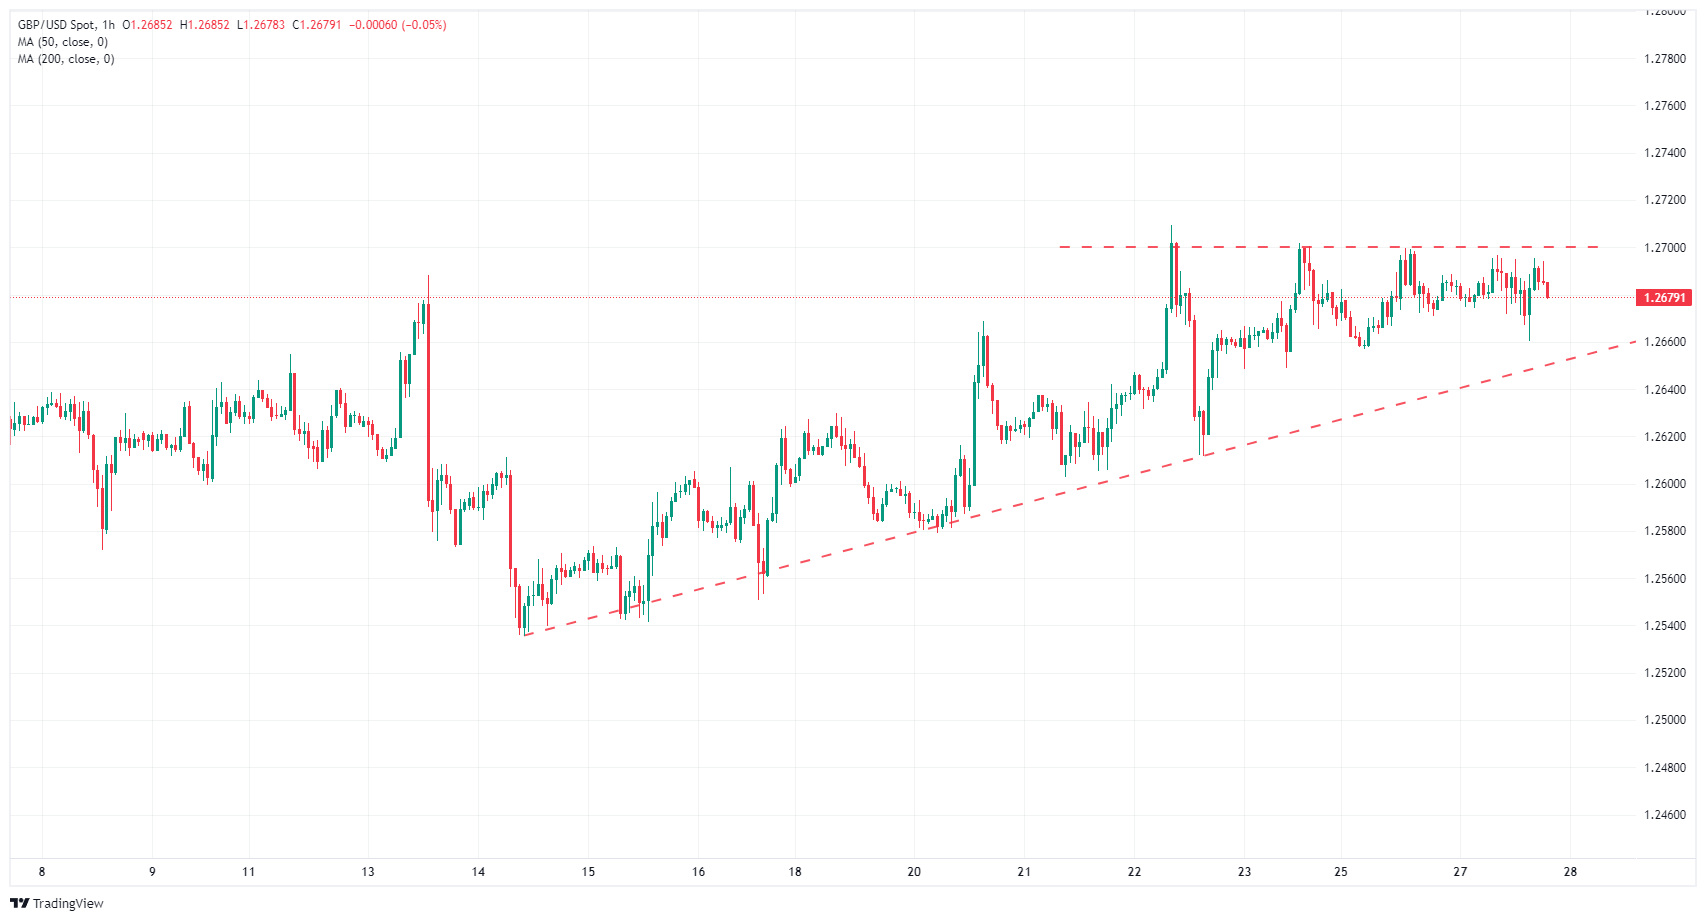
GBP/USD continues to churn at the intraday level, cycling 1.2650 trapped between technical resistance at the 1.2700 handle and rising near-term technical support from the last swing low into 1.2550.
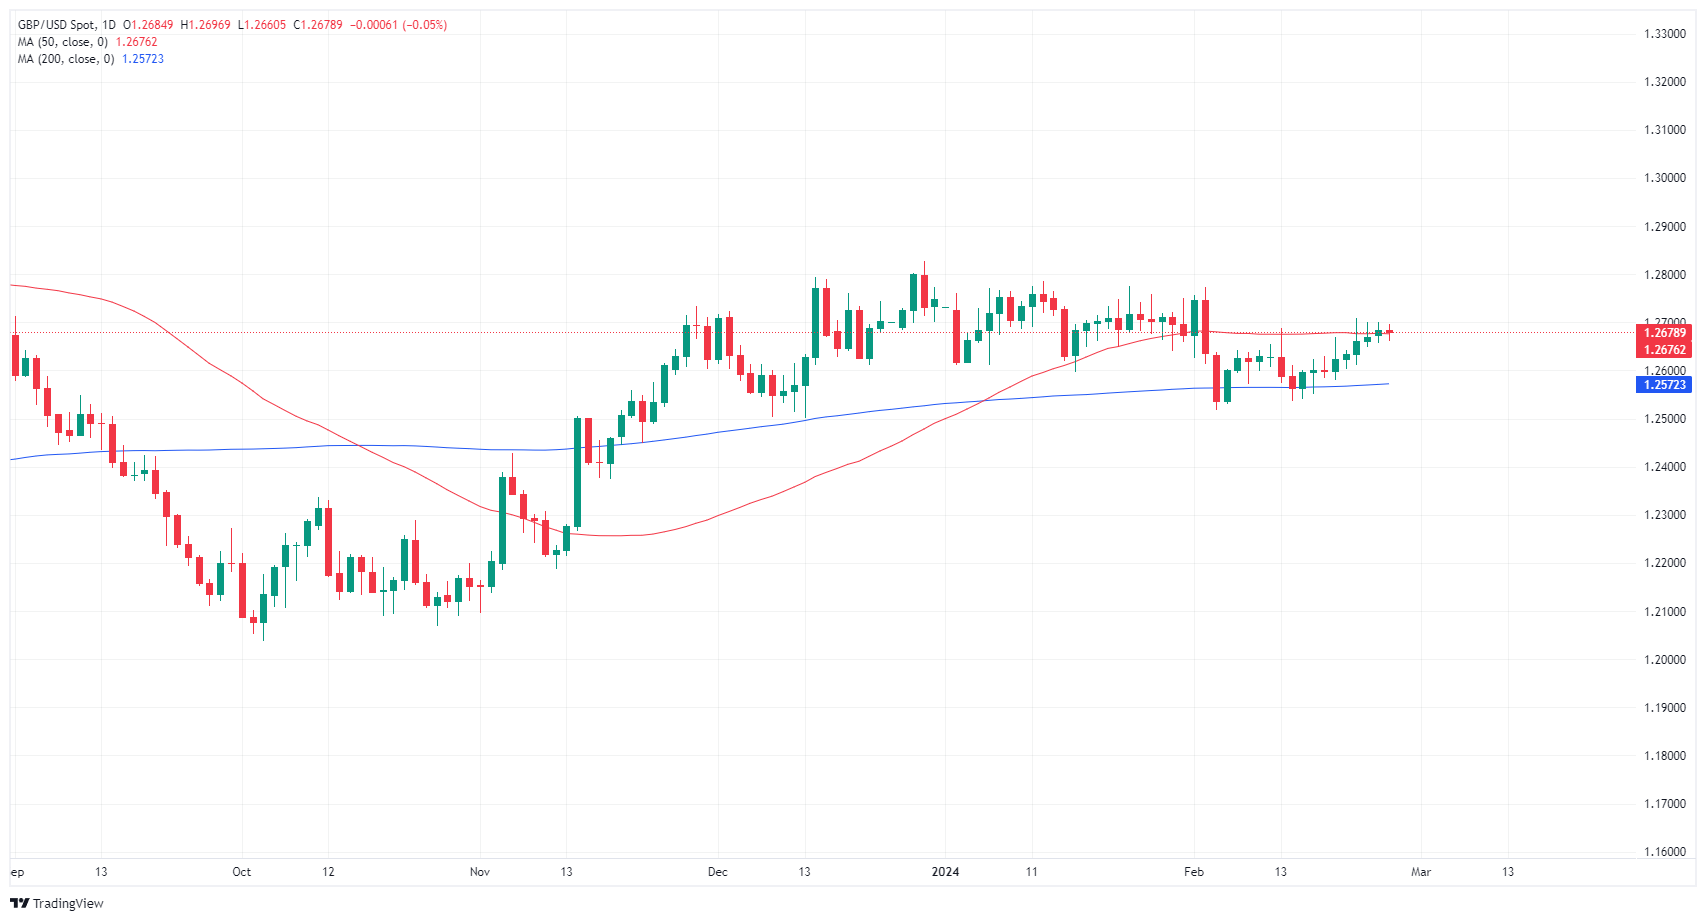
GBP/USD has run aground on the 50-day Simple Moving Average (SMA), but the pair is holding onto bull territory after a double bounce from the 200-day SMA near 1.2575.


 This “NEW CONCEPT” Trading Strategy Prints Money!… (INSANE Results!)
