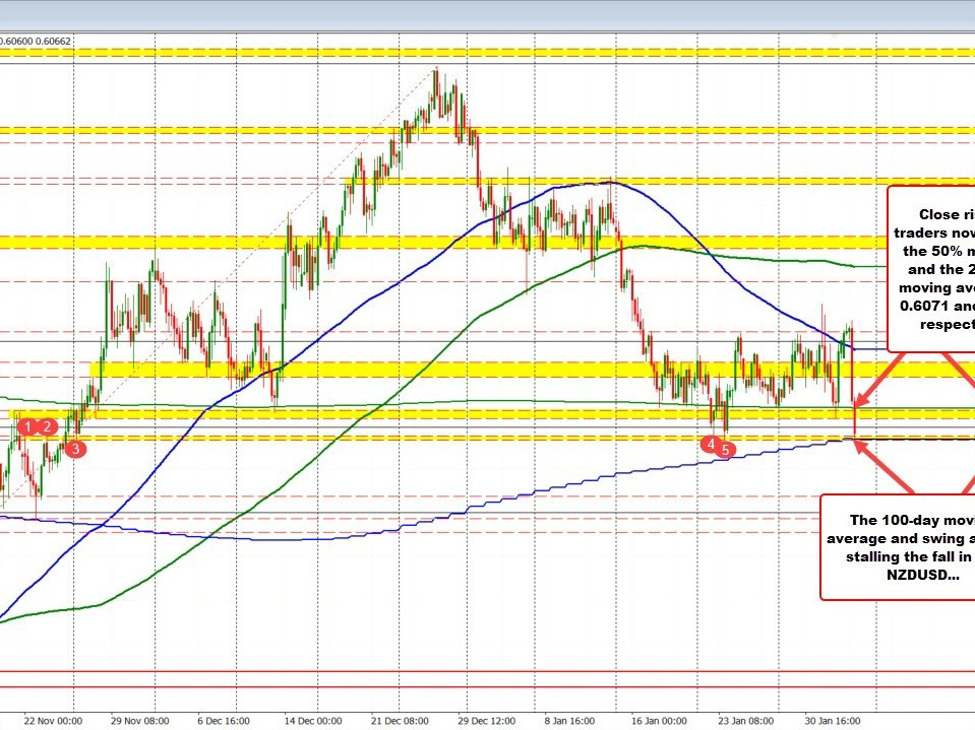
The NZDUSD moved sharply lower on the USD buying after the better than expected jobs data.
In doing so, the price of the pair has moved below it 200 day moving average or 0.6087, and the 50% midpoint of the move up from the October low the December high. That level comes in at 0.60716. Both those levels are now risk defining levels for sellers. Stay below is more bearish. Move above is more bullish.
At session highs, the price has moved down to test its key 100-day moving average at 0.60614. The price is also testing a swing area at the same level. As a result, there is some stall in the fall today as risk-focused traders buy against the level in hopes of a corrective move back to the upside, even if it is in the short-term. On a break, however, I would expect more selling.
NZDUSD stalling the fall near the 100 day MA
