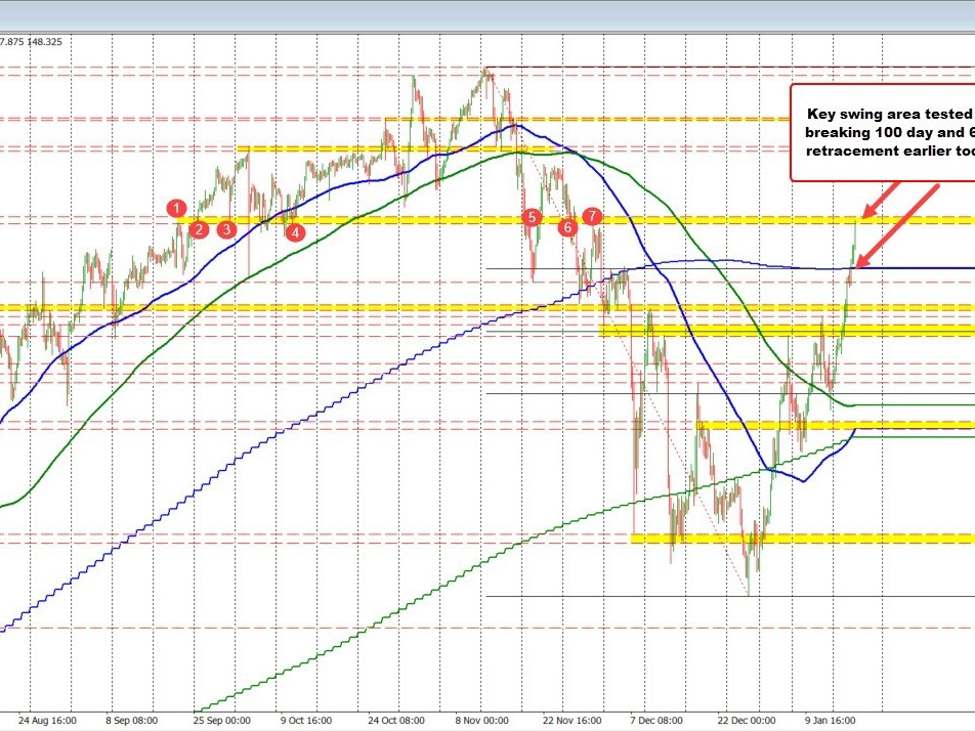
The USDJPY has continued it trend like move the upside today. In the process the price cracked above the 100-day moving average and 61.8% retracement of the move down from the November high. That level came in at 147.45. The subsequent run to the upside after that break, so the pair move up to a swing area between 148.449 and 148.590 (see red number circles on the chart below). Willing sellers have entered in that area and has pushed the price back to the downside
USDJPY moved higher and stalled at a swing area. What next?
What next?
Looking at the 5-minute chart below, the price action this week has seen most of the activity staying above its 100 and 200 bar moving averages (the blue and green lines on the chart below). Yes there have been moves below the 100-bar moving average (the blue line), but apart from early in the Asian session yesterday (which was quickly reversed), the buyers have stepped higher and higher and stayed above the 200 bar MA.
If the sellers are to start to “win”, the price needs to move below both the rising 100 and 200-bar moving averages and stay below those levels. Absent that the sellers are simply not winning. The buyers remain in full trend control.
