USDCAD below the 100 week MA
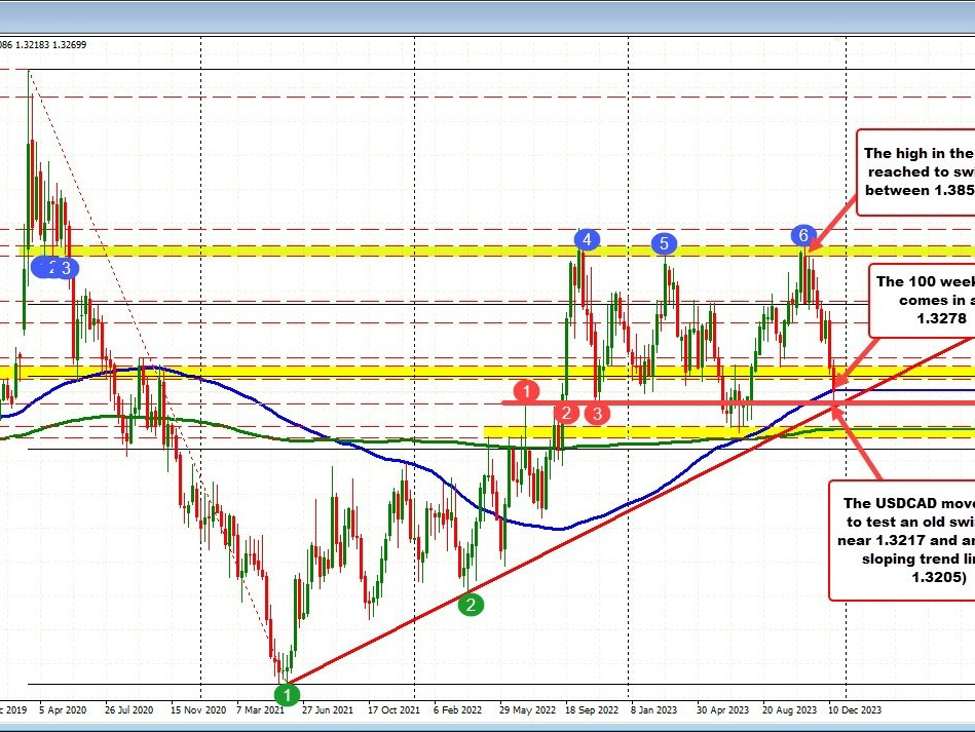
The USDCAD on the weekly chart is trading below its 100-week MA at 1.3278. A close below that MA would be the first since May 2022. That would be more bearish technically. Staying below keeps the sellers in firm control.
Having said that the pair moved down to test a swing level (going back to 2022) near 1.3217. An upward-sloping trend line cuts across not too far from that level at 1.3205. Both those levels are the next downside targets to get to and through to increase the bearish bias.
So big picture technically, the 1.3205 to 1.3277 is shaping up as a key area as we head into a new trading year. If the price of the USDCAD can stay below the 100-week MA….great for the bears. If the 1.3205 trend line can be broken… even more great.
Right here, however, understand that the sellers are still more in control with the 100 week MA the key and most recent reason. .
 This “NEW CONCEPT” Trading Strategy Prints Money!… (INSANE Results!)
 breakout perfect entry #forex #crypto #trading #trending