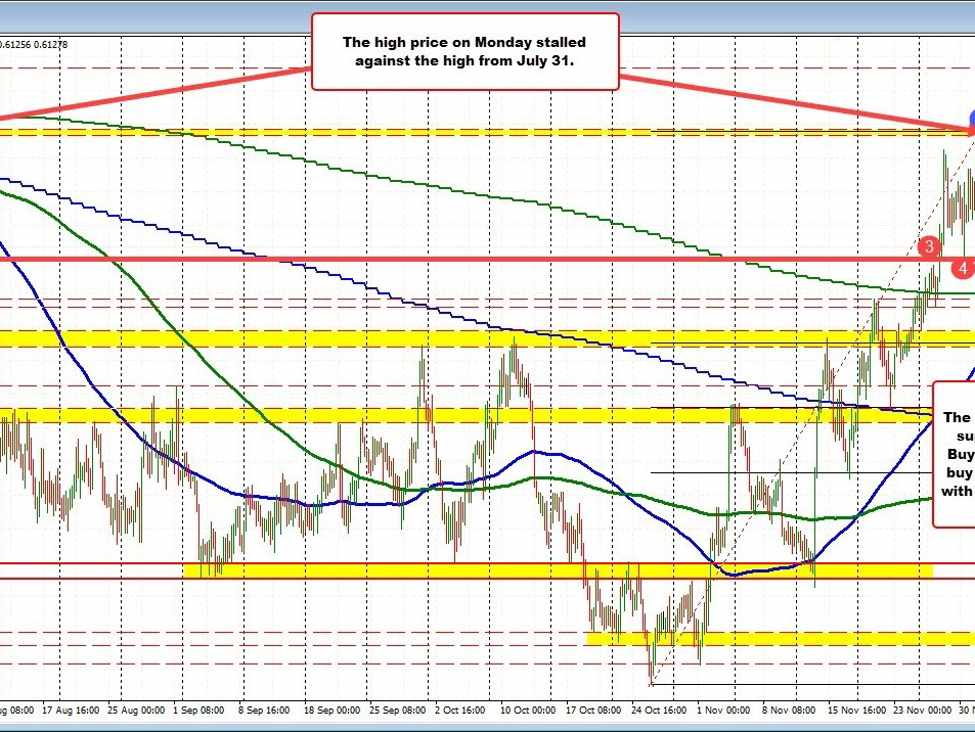
The NZDUSD on Monday peaked right near the high from the last time the price was at the levels on July 31 near 0.6221 (see blue numbered circle on the chart below).
NZDUSD falls to test support swing era
Willing sellers in the NZDUSD leaned against the level and have since pushed the price lower over the last two trading days. The low price today reached down to 0.6124. That got within seven pips of a swing area target near 0.6117 (see red numbered circles on the chart below). The price move lower has stalled near the support target.
What next?
Traders going into the new day have a choice to make at that swing level at 0.6117. Do buyers want to lean against that level and push the price back higher toward the Monday high at 0.6221? Or will that support level be broken with traders next looking toward the 200-hour moving average at 0.60893?
Drilling down to the hourly chart below, the low price today in addition to stalling near the swing level at 0.6117, is also stalling near its rising 200 hour moving average currently at 0.6131. Going forward, if support buyer’s stall the fall ahead of the 0.6117 level and move back away from the 200 hour moving average at 0.6131, traders would next look toward the 100-hour moving average (blue line on chart below) currently at 0.6165 for the next bias clues. Move above that 100-hour MA level and the buyers are in firm control once again and a retest of the high can be expected.
NZDUSD falls to the 200 hour MA

 RULE-BASED Pocket Option Strategy That Actually Works | Live Trading
 This “NEW CONCEPT” Trading Strategy Prints Money!… (INSANE Results!)
