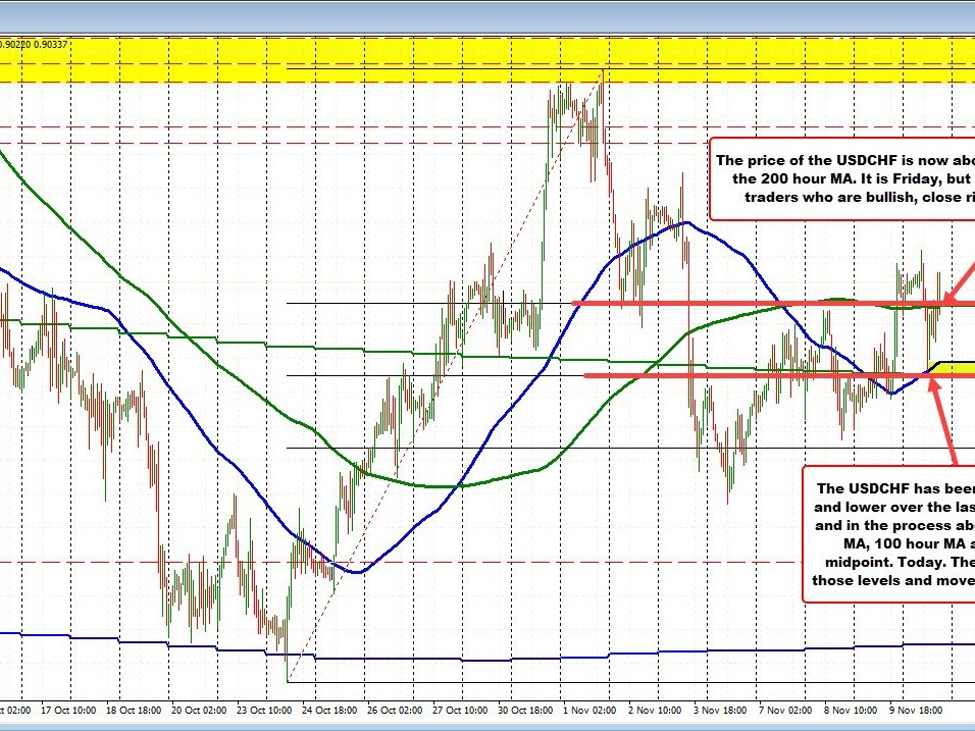
The USDCHF is higher on the week, but the price action has been up and down, especially over the last 4 trading days. Technically, the price has been moving above and below technical levels like the:
- 200-day moving average currently at 0.8999,
- 100-hour moving average currently at 0.9044, and the
- 50% midpoint of the move up from the October 24 low to the November high also at 0.8999.
Add the natural support at 0.9000 and the area is home to a cluster of technical levels.
Today, the dip in the European session found support against all those levels and the price has rotated back to the upside. More recently, the price has moved back above its higher 200-hour moving average (green line in the chart below) near 0.9025 and the broken 38.2% retracement of the same range since the October 24 low at 0.90261. That level is now a close risk/bias-defining level. However, because of the end-of-week flows and squaring up, traders should be aware that volatility can make that level not important.
Nevertheless, as we head into the end of the weekend into the new trading week, what we do know is that the 0.9000 area is certainly a key barometer and risk-defining level for both buyers and sellers. Staying above would be more bullish while moving below will be more bearish
