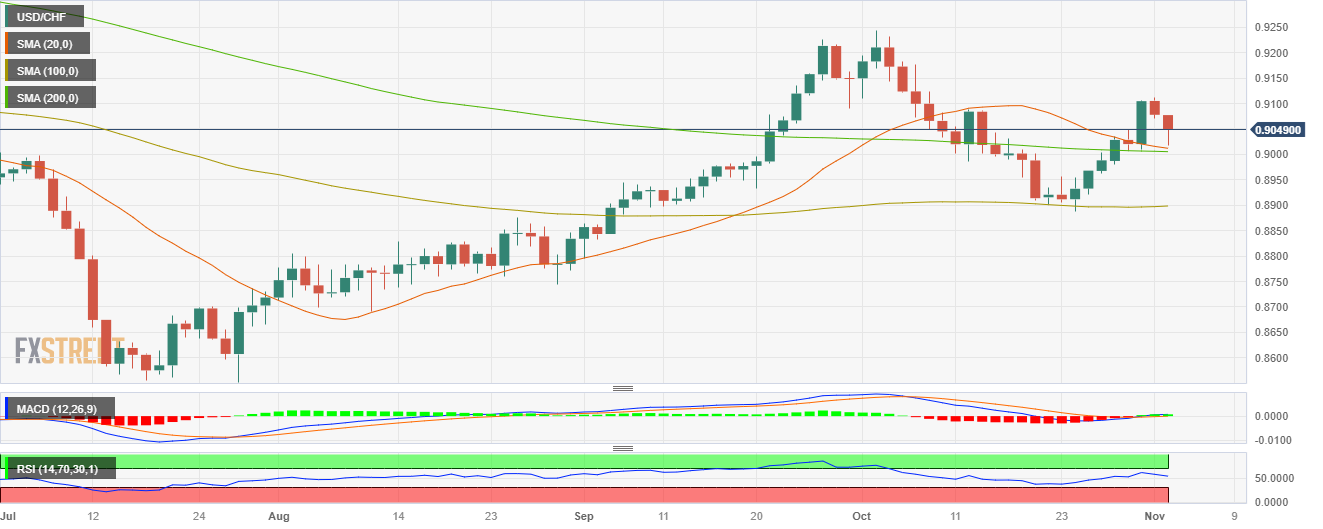
- USD/CHF fell to 0.9050, seeing 0.30% losses.
- The USD is losing interest due to the Fed dovish tone on Wednesday’s decision.
- Ahead of October’s Nonfarm Payrolls, the US reported weak labor market data.
- Indicators flash signals of further downside.
In Thursday’s session, the USD/CHF saw red, mainly driven by a broad USD weakness following the Federal Reserve’s (Fed) and Jerome Powell’s remarks on Wednesday. In addition, soft labour market data is adding to the Greenback’s weakness.
On Wednesday, Jerome Powell hinted that the bank has covered significant ground. He stated that for the next decision, tighter financial conditions will be considered, as well as the cumulative effects for the next decisions. As a reaction, markets took those messages as a signal that interest rates reached its peak, which triggered a wave of risk-on flows which weakened the US Dollar.
Ahead of October’s Nonfarm Payroll on Friday, the U.S. Department of Labor revealed that the Initial Jobless Claims from the week ending in October 28 came in above the consensus. The people filling for unemployment benefits came in at 217,000, higher than the consensus 210,000 and increased concerning its last reading of 212,000.
For Friday’s job report, markets expect that the US economy added 118,000 jobs, decelerating from its revised September reading of 336,000. Wage inflation measured by the Average Hourly Earnings is forecasted to slightly decelerate while Unemployment is expected to remain steady at 3.8%.
USD/CHF Levels to watch
Upon evaluating the daily chart, a neutral to bearish outlook is seen, with the balance starting to lean in favour of the bears, although they still have hurdles to overcome. The Relative Strength Index (RSI) has a negative slope above its midline, indicating weakening buying pressure, while the Moving Average Convergence (MACD) histogram shows rising red bars.
In addition, it is worth noticing that the 20 and 200-day Simple Moving Averages (SMA) are converging towards 0.9000 en route to perform a bearish cross, which could fuel further downside movements.
Support levels: 0.9030, 0.9015, 0.9000 (20 and 200-day SMA convergence)
Resistance levels: 0.9060, 0.9080, 0.9100.
USD/CHF Daily chart

