Major stock indices fell sharply today as yields continued their march higher. The 10 year yield rose 11.7 basis points to 4.799%. The 30-year is approaching 5% at 4.927%. Much stronger JOLTs job openings data was the catalyst for higher rates:
- Dow industrial average had its worst trading day since March 22
- NASDAQ index equaled its worst trading day since August 24
The final numbers for the day are showing:
- Dow industrial average -430.99 points or -1.29% at 33002.37
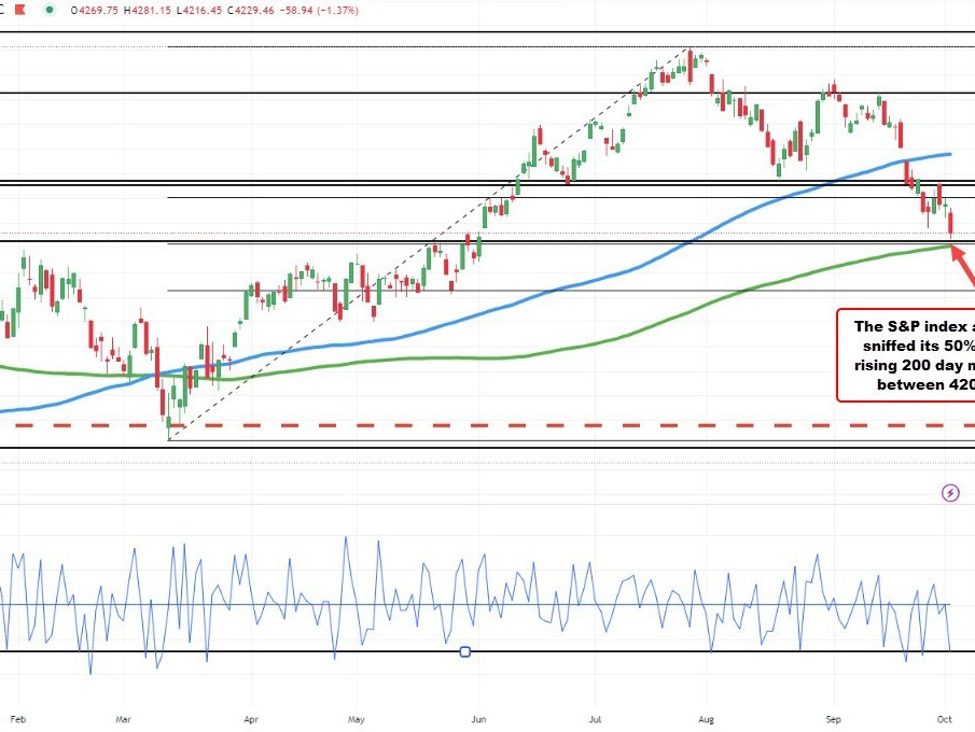
- S&P index fell -58.94 points or -1.37% at 4229.46
- NASDAQ and I fell -248.32 points or -1.87% at 13059.46
For the S&P index, it reached a low of 4216.45. That low got within 9 points of its 50% midpoint of the move up from the March 13 low at 4207. Just below that level is the 200-day moving average currently at 4201.98.
S&P sniffed the 50% and the 200 day MA
This article was originally published by Forexlive.com. Read the original article here.