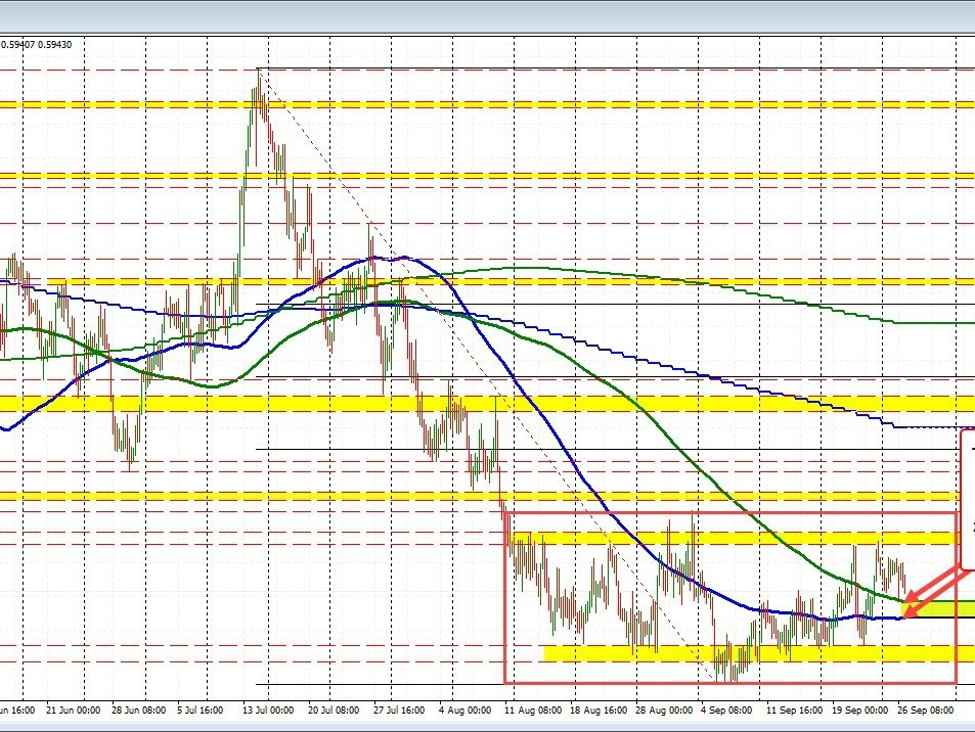
NZDUSD moves toward the 200 bar moving average
The NZDUSD is pushing back toward the lows for the day and in the process it is moving back toward the 200 bar MA on the 4-hour chart at 0.5933.
Earlier in the European session, the price tested that moving average line only to bounce back higher, but momentum faded ahead of the highs from Monday, and the price has started to move back to the downside. The low price for the current bar has reached 0.59407.
In the new trading day, moving below the 200-bar moving average will have traders targeting the 100 bar moving averages at 0.59188. Ultimately it would take a move below that moving average to tilt the bias more in favor of the sellers.
Big picture, the NZDUSD is mired in a “red box” that has confined the pair between 0.5858 and 0.6015. There is a higher swing area between 0.5985 to 0.5996, that if broken would give a more bullish bias. Conversely, there is a lower swing area between 0.5879 and 0.5894 that if broken would increase the bearish bias.
