- Gold Price stays pressured for the fourth consecutive day despite lacking downside momentum.
- Upbeat headlines from China, Country Garden fails to impress XAU/USD buyers as US Dollar traces firmer yields.
- US Factory Orders, ISM Services PMI and risk catalysts eyed for clear Gold Price directions.
- XAU/USD bears have a tough time keeping control unless breaking $1,930 and $1,915 key support confluences.
Gold Price (XAU/USD) remains on the back foot for the fourth consecutive day even as the bears struggle to gain market acceptance ahead of the top-tier US data. In doing so, the yellow metal portrays the trader’s cautious optimism as full markets return after a long weekend in the US.
That said, the doubts about China’s capacity to defend the economic recovery join firmer US Treasury bond yields, which in turn underpins the US Dollar’s rebound amid a sluggish session.
It should be noted that Friday’s upbeat US Nonfarm Payrolls (NFP), global rating agency Moody’s upbeat revision to the US growth forecasts and hawkish comments from Federal Reserve Bank of Cleveland President Loretta J. Mester seem to keep the US Dollar firmer, as well as exert downside pressure on the Gold Price.
Alternatively, the risk-positive news from China’s biggest reality player Country Garden and Beijing’s efforts to defend economic recovery via multiple qualitative and quantitative measures should have prod the Gold sellers but failed to do so amid the recently firmer Greenback.
Moving on, the full markets’ reaction to the latest shift in sentiment and today’s US Factory Orders for July, as well as the Fed concerns, will be important to watch for clear directions.
Also read: Gold Price Forecast: XAU/USD struggles below $1,950 amid a Bear Cross
Gold Price: Key levels to watch
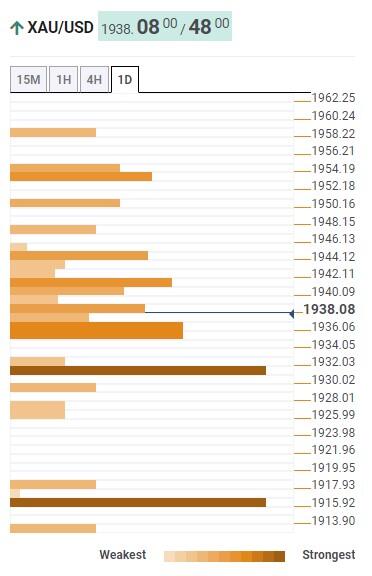
As per our Technical Confluence indicator, the Gold Price floats firmly beyond the $1,930-32 support confluence comprising the Pivot Point one-day S2, 50-day SMA and 200-SMA on four-hour (4H).
That said, a convergence of the Pivot Point one-day S1, Fibonacci 61.8% on one-month and the lower band of the Bollinger on the 4H restricts the immediate downside of the Gold Price near $1,935.
In a case where the Gold Price remains bearish past $1,930, the 200-day SMA, the middle band of the Bollinger and Fibonacci 38.2% on one-month, close to $1,915 by the press time, will act as the last defense of the XAU/USD buyers.
Alternatively, a convergence of the Fibonacci 38.2% on one-day and the middle band of the Bollinger on 4H, close to $1,945, guards immediate recovery of the Gold Price.
Following that, the Pivot Point one-day R3, 100-day SMA and Fibonacci 161.8% on one-day, will act as a tough nut to crack for the Gold buyers around $1,955.
It’s worth noting that the Gold Price run-up beyond $1,955 will enable buyers to aim for an area comprising multiple hurdles marked during May and July, around $1,985.
Here is how it looks on the tool
About Technical Confluences Detector
The TCD (Technical Confluences Detector) is a tool to locate and point out those price levels where there is a congestion of indicators, moving averages, Fibonacci levels, Pivot Points, etc. If you are a short-term trader, you will find entry points for counter-trend strategies and hunt a few points at a time. If you are a medium-to-long-term trader, this tool will allow you to know in advance the price levels where a medium-to-long-term trend may stop and rest, where to unwind positions, or where to increase your position size.

