The AUDUSD has a unique symmetry that has retracement levels of the sharp move lower in June equal to the retracement levels of the sharp move higher in July in the pair (you have to see it on the video to believe it).
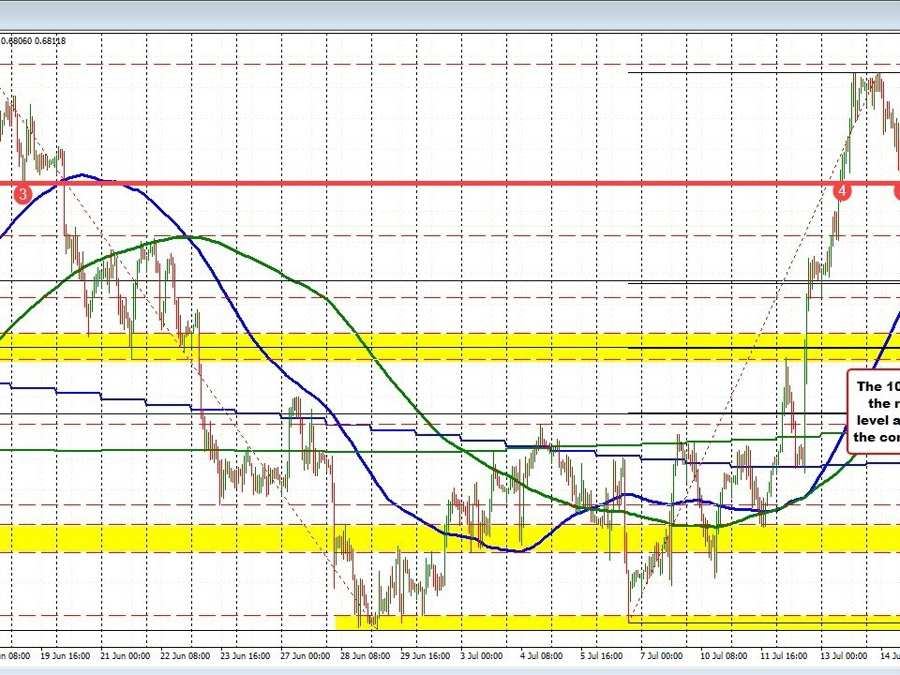
The AUDUSD pair did move up last week and tested the swing high going back to mid-June, where sellers leaned on Friday and corrected the pair lower. That correction today has seen the pair test and move below the rising 100-hour moving average (at 0.6800), but fall short of the 38.2% retracement of the move higher in July/or the broken 61.8% retracement of the move down in June at 0.67814.
When the price has bounced back above the rising 100-hour moving average which is not too surprising. Traders will be watching the 0.6835 level on the top side as a barometer for both buyers and sellers intraday.
AUDUSD bounces in area near 100 hour MA and retracement