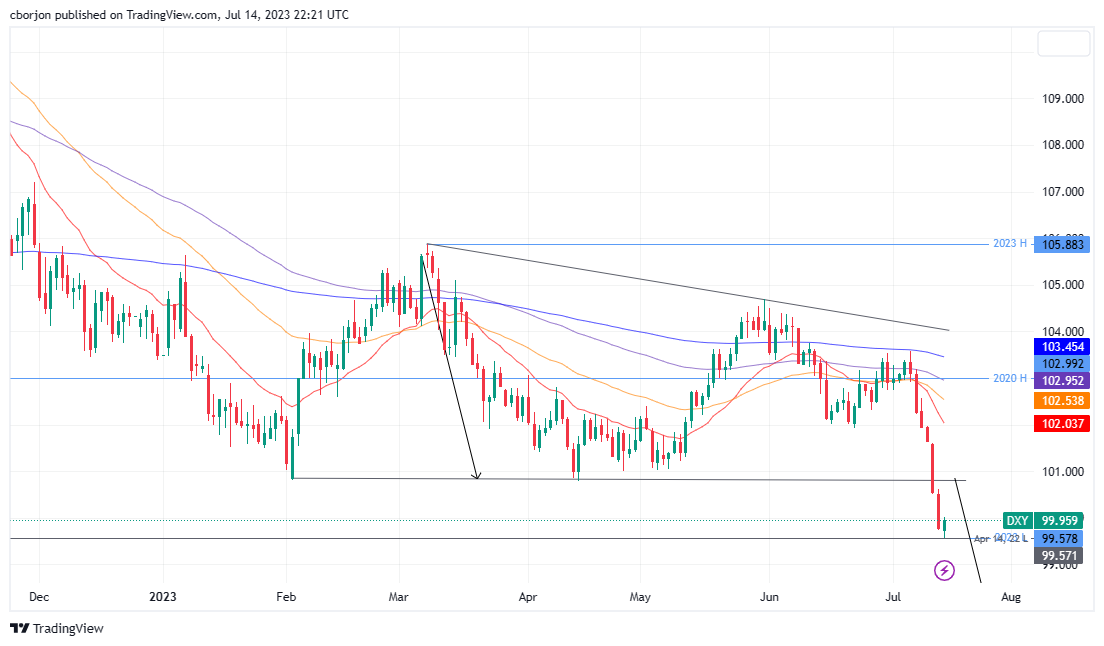
- US Dollar Index (DXY), which measures the US Dollar’s performance against a basket of six currencies, shows slight gains after reaching a fresh 15-month low of 99.578.
- June’s US CPI grew 3.0% YoY, underperforming the 3.1% forecast, while Core CPI fell by 0.5%. Concurrently, June’s PPI rose less than the expected 0.1% YoY.
- Considering these conditions, markets now expect fewer Fed rate hikes post-July FOMC, forecasting a stable Federal Funds Rate around 5.25%-5.50% in 2023.
The US Dollar Index (DXY), which measures the US Dollar (USD) performance against a basket of six currencies, recovers some ground, as the DXY prints gains of 0.18% after hitting a fresh 15-month low of 99.578. At the time of writing, the DXY exchanges hands at 99.959, shy of reclaiming the 100.000 figure.
DXY faces pressure from lower consumer and producer price indices, leading to huge losses in the week
The greenback stood under a lot of stress in a busy economic docket., mainly driven by inflation figures, with consumer prices and producer prices edging lower, weakening the US Dollar (USD).
The June US Consumer Price Index (CPI) expanded by 3.0% YoY, falling below the estimated 3.1%. Furthermore, the Core CPI, which excludes volatile items such as food and energy, decreased by 0.5%, dropping from 5.3% in May to 4.8% last month. Meanwhile, the release of the Producer Price Index (PPI) for the same period expanded by 0.1%, YoY below forecasts of 0%, while the so-called Core PPI, on a yearly basis cooled down compared to expectations of 2.6% and came at 2.4%.
Given the backdrop, market participants trimmed their bets the US Federal Reserve (Fed) would hike rates past July’s Federal Open Market Committee (FOMC) meeting on 25-26, with investors pricing in a 25 basis points (bps) increase. Hence, the Federal Funds Rates (FFR) is expected to remain through 2023 at around the 5.25%-5.50% range, as shown by the CME FedWatch Tool.
Consequently, US Treasury bond yields extended their losses. The US 2-year Treasury bond yield finished the week at 4.772%, almost 18 basis points lower than Monday’s open, while the 10-year plunged a quarter of percentage points lower, to 3.834%. That was a heavy burden for the greenback, as shown by the DXY, finishing the week with hefty losses of 2.26%.
US Dollar Index (DXY): Technical outlook
From a technical standpoint, once the DXY extended its losses past the February 2 daily low of 100.820, it opened the door for further losses. As of writing, DXY’s first support emerged on April 14, 2022, daily low of 99.571. Once cleared, the buck could edge toward the March 30, 2022, low of 97.685 before challenging the 2021 yearly low of 96.938. On the flip side, the DXY first supply area would be the February 2 low-turned resistance at 100.820, followed by the 20-day EMA at 102.037.

