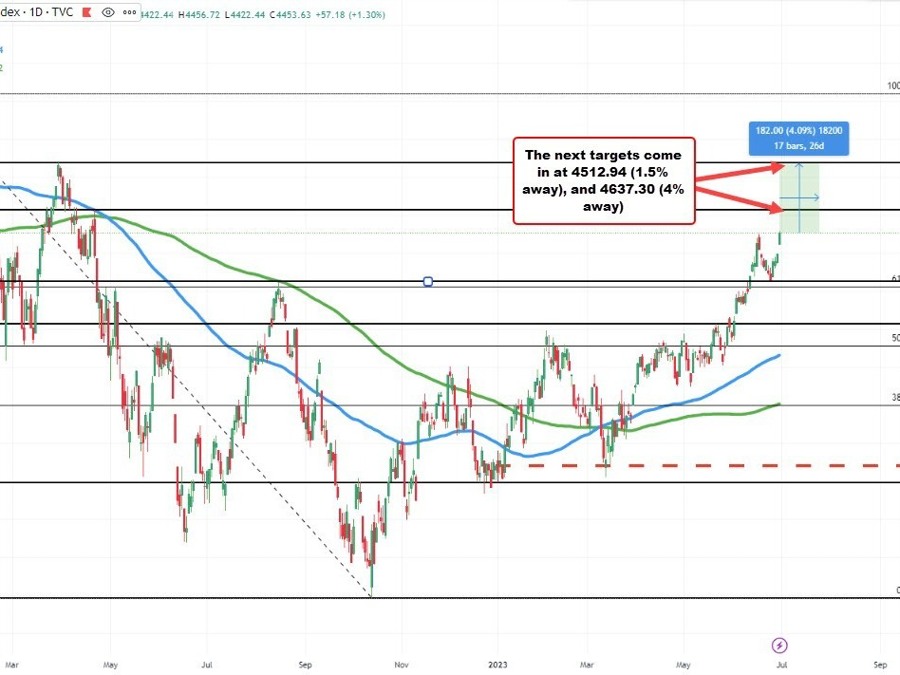
S&P index trades to new 2023 highs
As a market heads into the close for the week, month, and quarter, the S&P today is extending to new highs for the year. The price extended above the June 16 high at 4448.47 to an intraday high of 4456.72. The current price trades at 4452.22.
Technically, this month’s low came on June 1 (the first day of the month) at 4171.64. That low was above the 50% midpoint of the move down from January 2022 all-time high. The price closed above its 61.8% retracement on June 12 at 4311.69, and stayed above that level since that day.
The next target on the daily chart is up at 4512.94. That corresponds with the high price going back to April 21, 2022. That’s only 1.5% away. The swing live from March 29 at 4637.30 is 4.09% away.
The S&P index this month is up 6.56% which is the largest gain since October 2022. For the quarter, the index is now up 8.39% which is the largest increase since the 4th quarter of 2021.

 This “NEW CONCEPT” Trading Strategy Prints Money!… (INSANE Results!)
 breakout perfect entry #forex #crypto #trading #trending