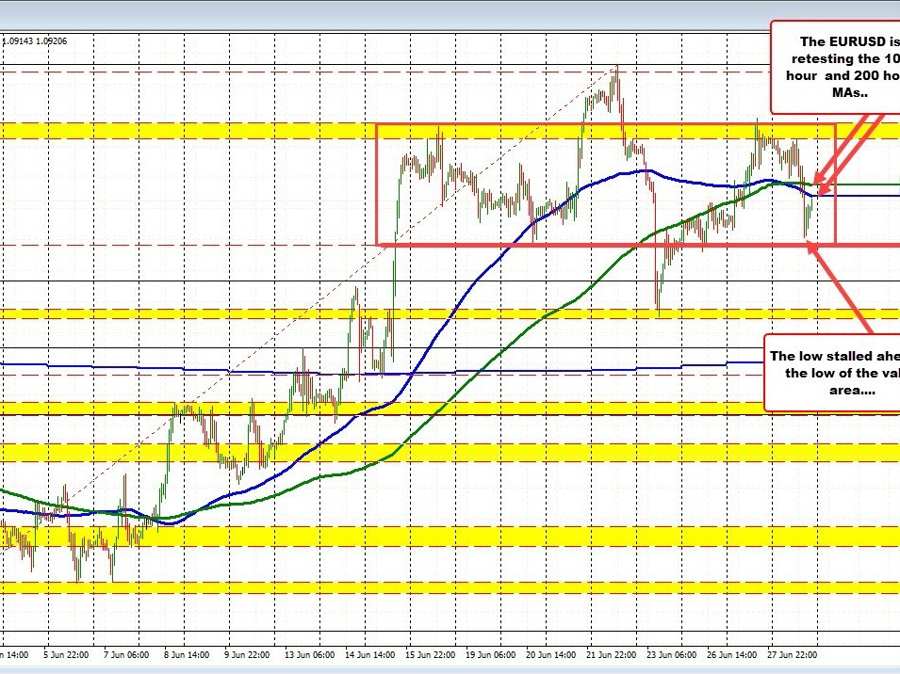
EURUSD retests the 100 hour MA
In the video, from earlier today, I outlined the “value area” where most of the trading activity has occurred over the last 9-10 days. That range is from about 1.0890 up to 1.0973 (give or take a few pips). In between sits the near-converged 100 and 200-hour moving averages. The 100-hour moving average is currently at 1.09238 (blue line in the chart above). The 200-hour moving average is currently at 1.09314 (green lines in the chart above).
The low price today approached the lower end of the extreme. The low price reached 1.0896 after falling below the 100-hour moving average during the central bank panel discussion.
The subsequent rise has now taken the prize back toward the falling 100-hour moving average. Do the sellers, and against that level and keep the sellers more in control, or do the buyers overwhelm and pushed the price above the 200-hour moving average as well at 1.09314.
Clearly, there are moves higher and lower in this currency pair. The overall range is still relatively modest especially if you focus on the value portion of the up and down range over the last 8-9 days. At some point there will be a break and run. For now, the sellers hold the advantage below the moving averages. Can they keep that advantage?
To watch the earlier video click on the video below:
