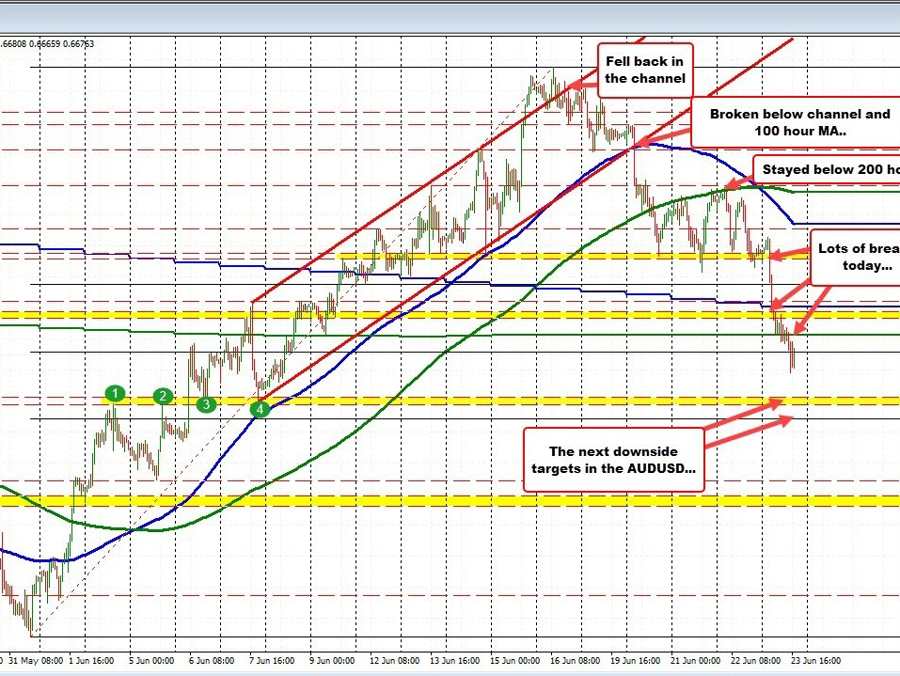
The AUDUSD started to show cracks in its bullish bias last Friday, and that crack led to a bigger and bigger move as technical levels were taken out one by one.
First, it was the 100-hour moving average (higher blue line) and channel trendline. That led to a break of the 200-hour moving average. The price traded up and down on parts of Tuesday, Wednesday and Thursday, but kept mostly below the 200-hour moving average on moves higher. In trading today, the price has tumbled below the:
- 38.2% retracement of the move up from the May 31 low,
- 100-day moving average of 0.6713,
- 200-day moving average at 0.66913, and more recently the
- 50% midpoint of the essay move higher at 0.66785
Sellers keep on pushing.
What would ruin the bearish bias now?
Getting back above the 200-day moving average at 0.66913 and the 100-day moving average of 0.6713 would give buyers some hope. Absent that and sellers would look to target a swing area between 0.6637 and 0.6643, followed by the 61.8% retracement of the move up from the May 31 low at 0.6626 as a next major target.
AUDUSD steps lower this week. What would ruin the sellers?
