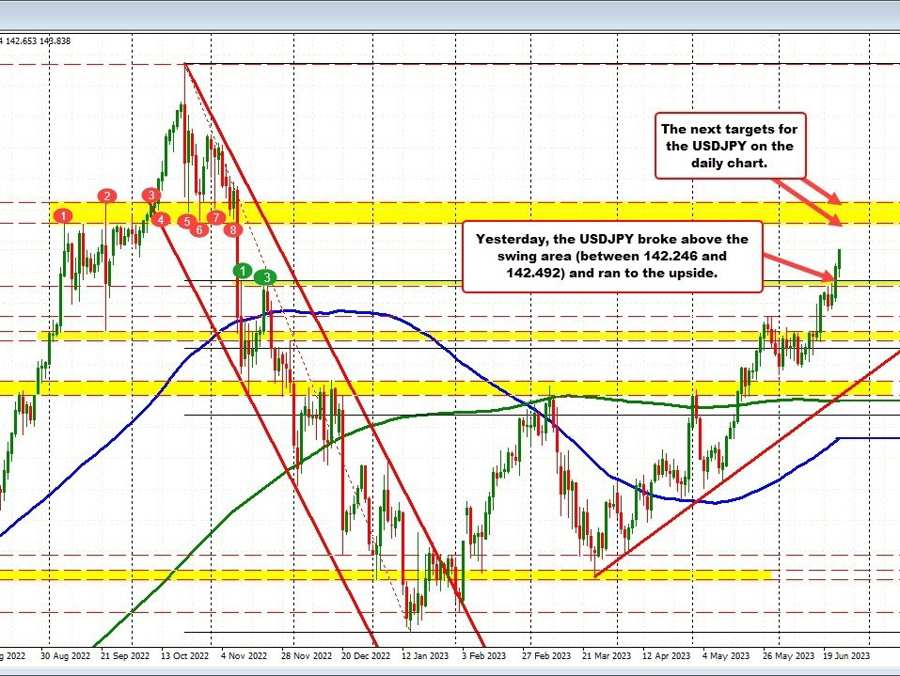
The USDJPY has moved higher (lower JPY) despite higher inflation data out of Japan today.
USDJPY on daily chart breaks higher
The move higher this week was kickstarted yesterday after the pair broke above a swing area between 142.24 and 142.49. The price also moved above the 61.8% retracement level of the move down from the 2022 high to the 2023 low. Getting above that area open the door for further upside probing and the market has responded. The high price today has reached 143.856.
Looking at the daily chart, there is room to room. Going back to November 10, the price will below a swing area between 144.98 and 145.90. The low of that area at 145.00 is the next major target. That is still 115 pips away, but is certainly the next target that traders are eyeing.
Drilling to the hourly chart, the buyers stayed in control on Tuesday, Wednesday, and early Thursday when the pair stalled – on dips – against its 100-hour moving average (blue line in the chart below). That gave the buyers a go-ahead to push higher yesterday, and when the price extended above 142.49 (61.8%), the buying intensified.
USDJPY based at the 100 hour MA this week
