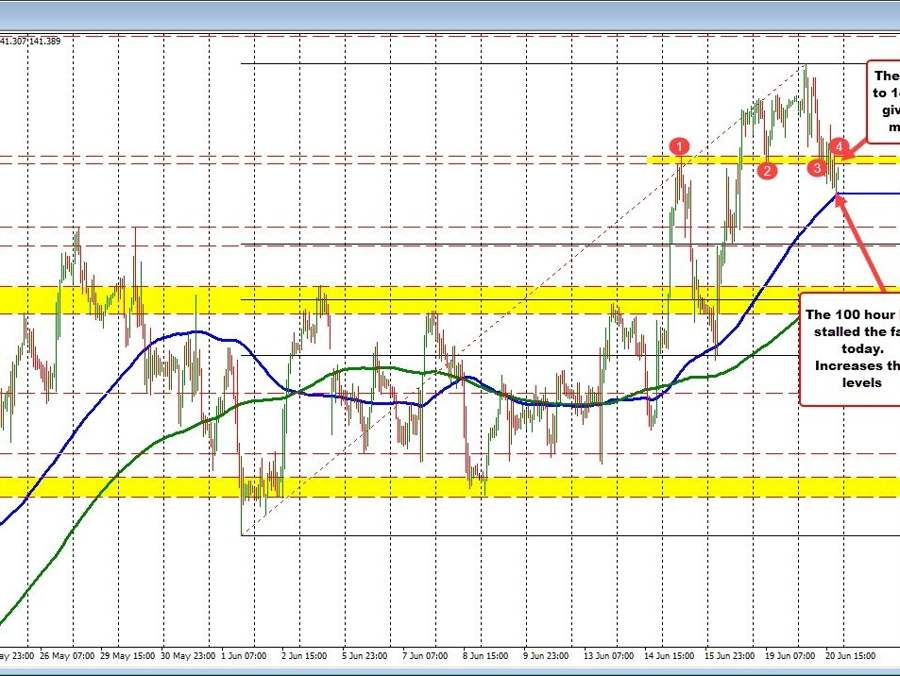
The USDJPY has been stepping lower today after trading at the highest level since November 2022. That high price at 142.247 bested the November 21 high at 142.246 by the slimmest of margins, but quickly turned around (see daily chart).
USDJPY stalled at the high from November 2022
The subsequent move to the downside has seen the price stall against the 100-hour MA in the last hour or so of trading. Buyers have leaned against the level on the 1st test. That increases the levels importance going forward. It will take a move below the 100 hour moving average to increase the bearish bias.
What next?
Traders will watch the swing high from last Thursday’s trade at 141.497. The swing low from yesterday’s trading at 141.432 makes the swing area between those 2 levels an area to get to and through. Getting above would give the dip buyers against the 100-hour moving more confidence that the low is in place.
USDJPY on the hourly chart stalled the fall at the 100H MA
Conversely, if the price cannot get above that level, the 100-hour moving average will come back into play. Breaking below it would have traders looking toward the swing highs from May 29 and May 30 at 140.924 (see green numbered circles). Below that, and the 38.2% retracement of the move up from the June 1 low would be targeted at 140.75.
