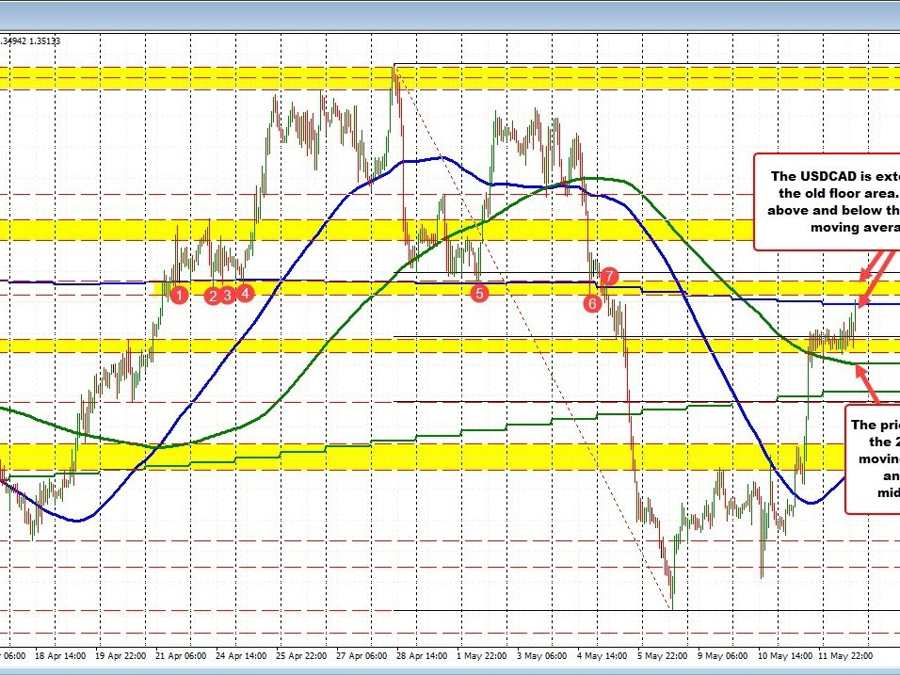
USDCAD moves above 100 day moving average
The USDCAD is extended to a new session high and in the process testing/moving above the 100-day moving average at 1.35116. Just above that level is a key swing area floor that stalled the market between April 21 and May 5. That area comes between 1.3517 and 1.35266 (see red numbered circles). The floor area should be a solid resistance on the 1st test.
In a trading yesterday, the price moved sharply to the upside and in the process moved above the 200-hour moving average (green line in the chart above). In trading today, the price low’s estate above that moving average currently at 1.34728, giving the buyers ammunition to push to the upside.
For the trading week, the low for the pair came in on Monday at 1.33137. The big day was yesterday when the price trended from the closing level of 1.33732 on Wednesday, to a high price yesterday of 1.3495 before settling into the close.
That move took the price to the 50% midpoint of the range since April 28 at 1.34905 where price action stalled. The move to the upside currently is breaking away from that 50% midpoint.
If the price stalls within the swing area now (old floor), getting back below the 100-day moving average at 1.35116 and the 50% midpoint at 1.34905 would give sellers more comfort.
On a break of 135.265, it should open the door for further upside momentum. Watch the 1.3553 – 1.3566 area as the next major swing area.
