- USD/JPY tests 50-day EMA at 133.85; bullish-engulfing pattern hints at a potential uptrend.
- Downside risks loom, with the 100-day EMA at 132.83 in sight if 134.00 support breaks.
The USD/JPY rises after dropping to a weekly low of 133.50, advances 0.42%, spurred by buyers stepping in at around solid technical support level. An upbeat April Nonfarm Payrolls report also lifted the US Dollar (USD) vs. the Japanese Yen (JPY) safety. At the time of writing, the USD/JPY is trading at 134.81 after dipping to a low of 133.88.
USD/JPY Price Action
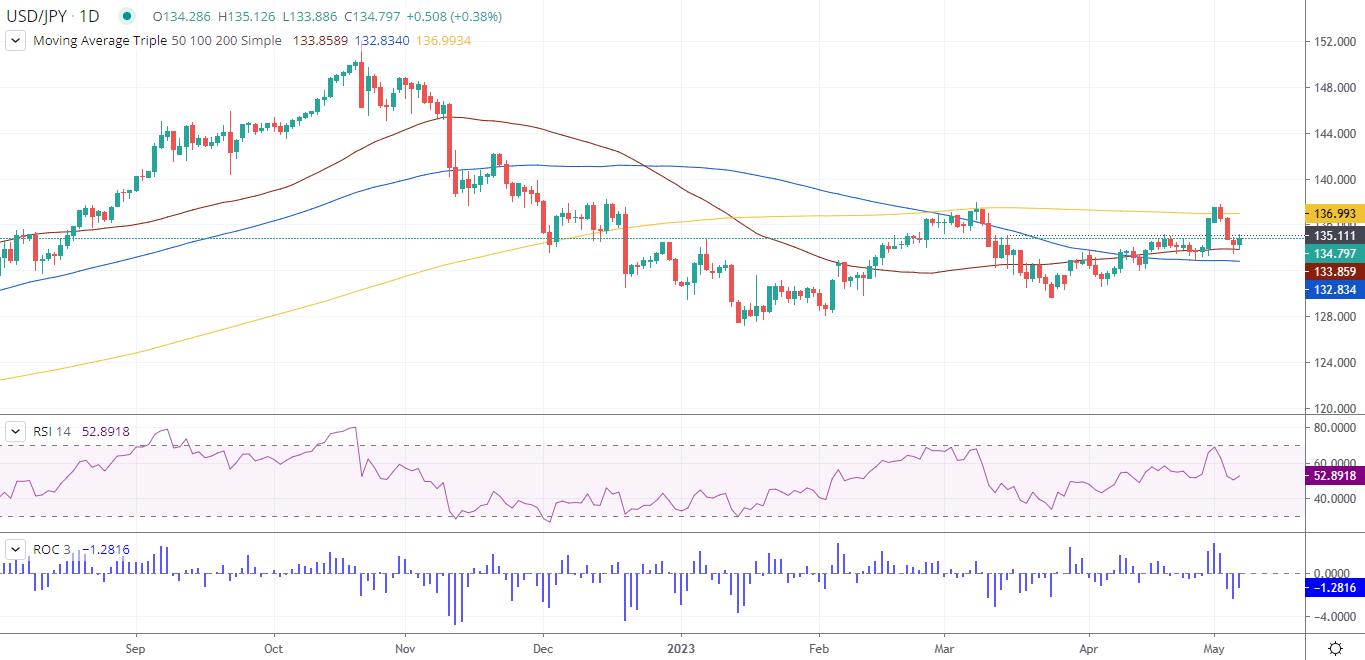
From a daily chart perspective, the USD/JPY remains neutrally biased, though testing the 50-day Exponential Moving Average at 133.85, as the pair battles on closing above the May 4 daily high of 134.85. If USD/JPY achieves a daily close above the latter, the major will form a bullish-engulfing candlestick pattern, keeping buyers hopeful of higher prices.
In that outcome, the USD/JPY next resistance would be 135.00, and the March 15 daily high at 135.11. Once cleared, the USD/JPY would have a clear path to 136.00 until testing the 200-day EMA at 136.99.
Oscillators, like the Relative Strength Index (RSI) indicator, aim up and is still above neutral territory. The Rate of Change (RoC) of the last three days suggests that sellers are losing momentum. Therefore, the USD/JPY would continue to uptrend.
However, if USD/JPY falls below 134.00, it would expose the 50-day EMA at 133.85, followed by the 133.00 figure. Downside risks would pave the way toward the 100-day EMA At 132.83.

