- GBP/USD is sliding and forming a peak formation.
- Bears are seeking a move down to test the 1.2620s.
GBP/USD is being pressured to the downside in lunchtime NY trade and is taking on a support structure that could lead the way to a move into test the 1.2020s and lower for the remainder of the day.
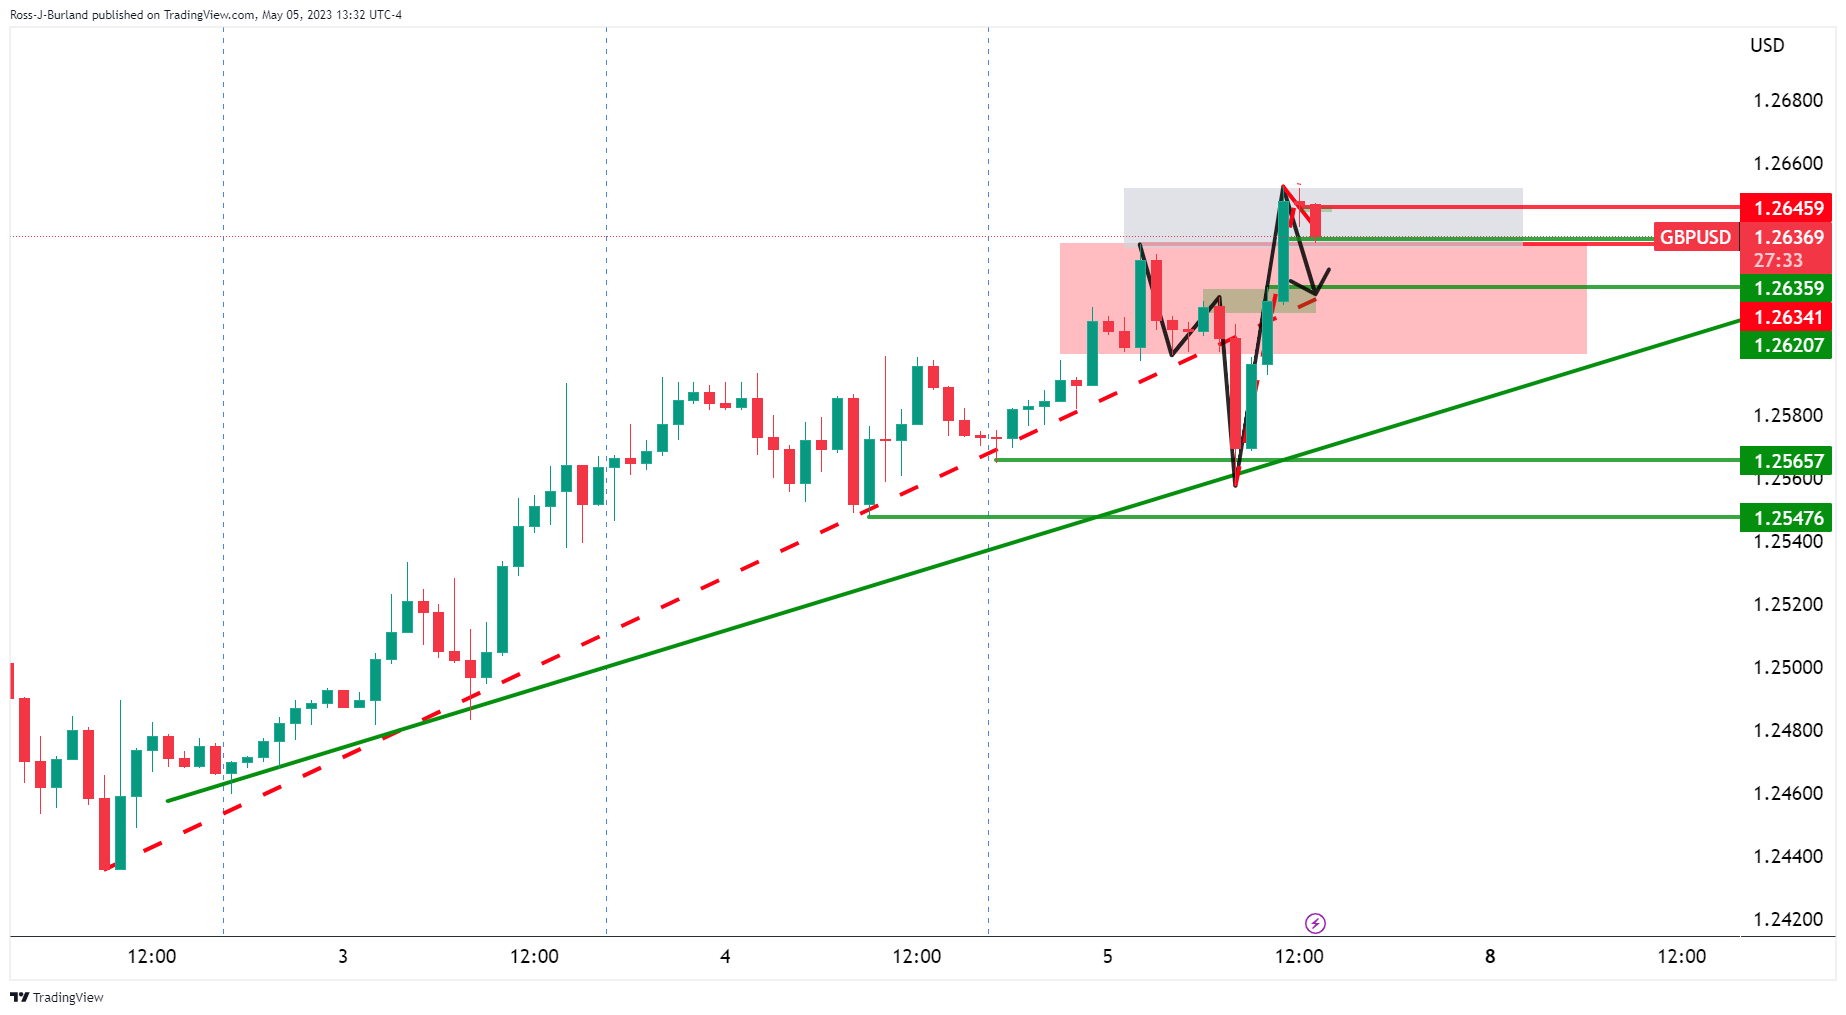
GBP/USD H1 chart
The hourly chart shows GBP/USD peaking in the 1.2650s and this gives rise to a test of the neckline of the W-formation as illustrated in the above chart.
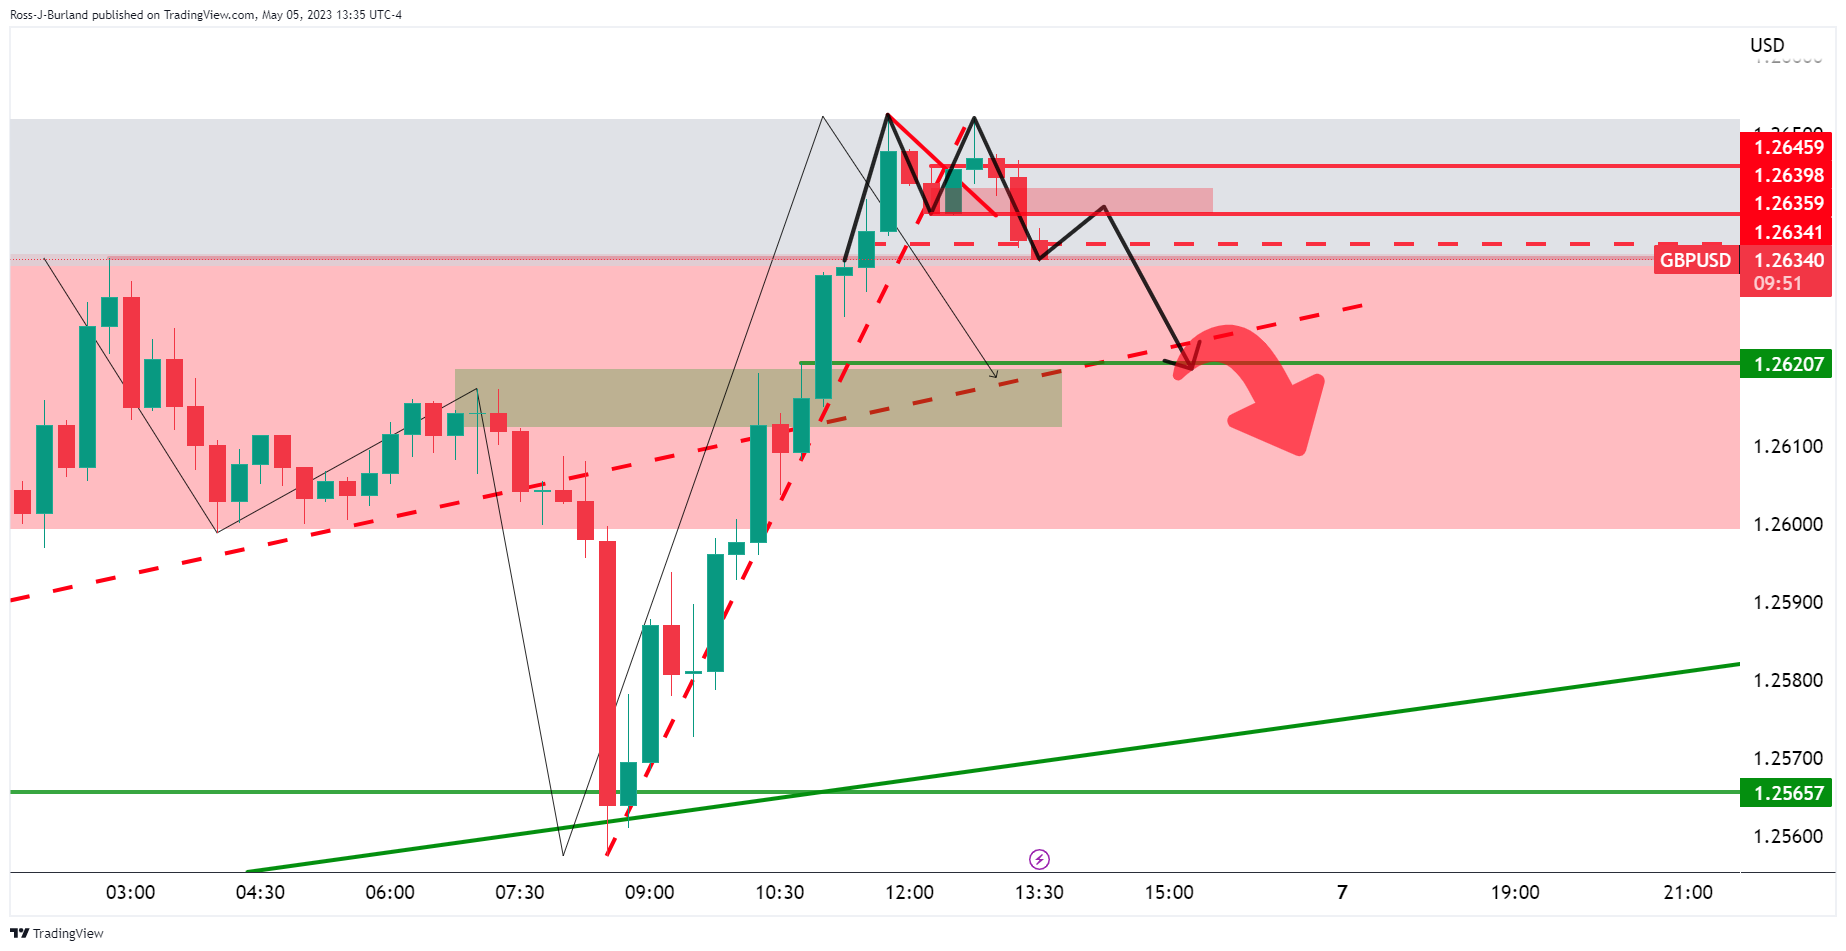
GBP/USD M15 chart
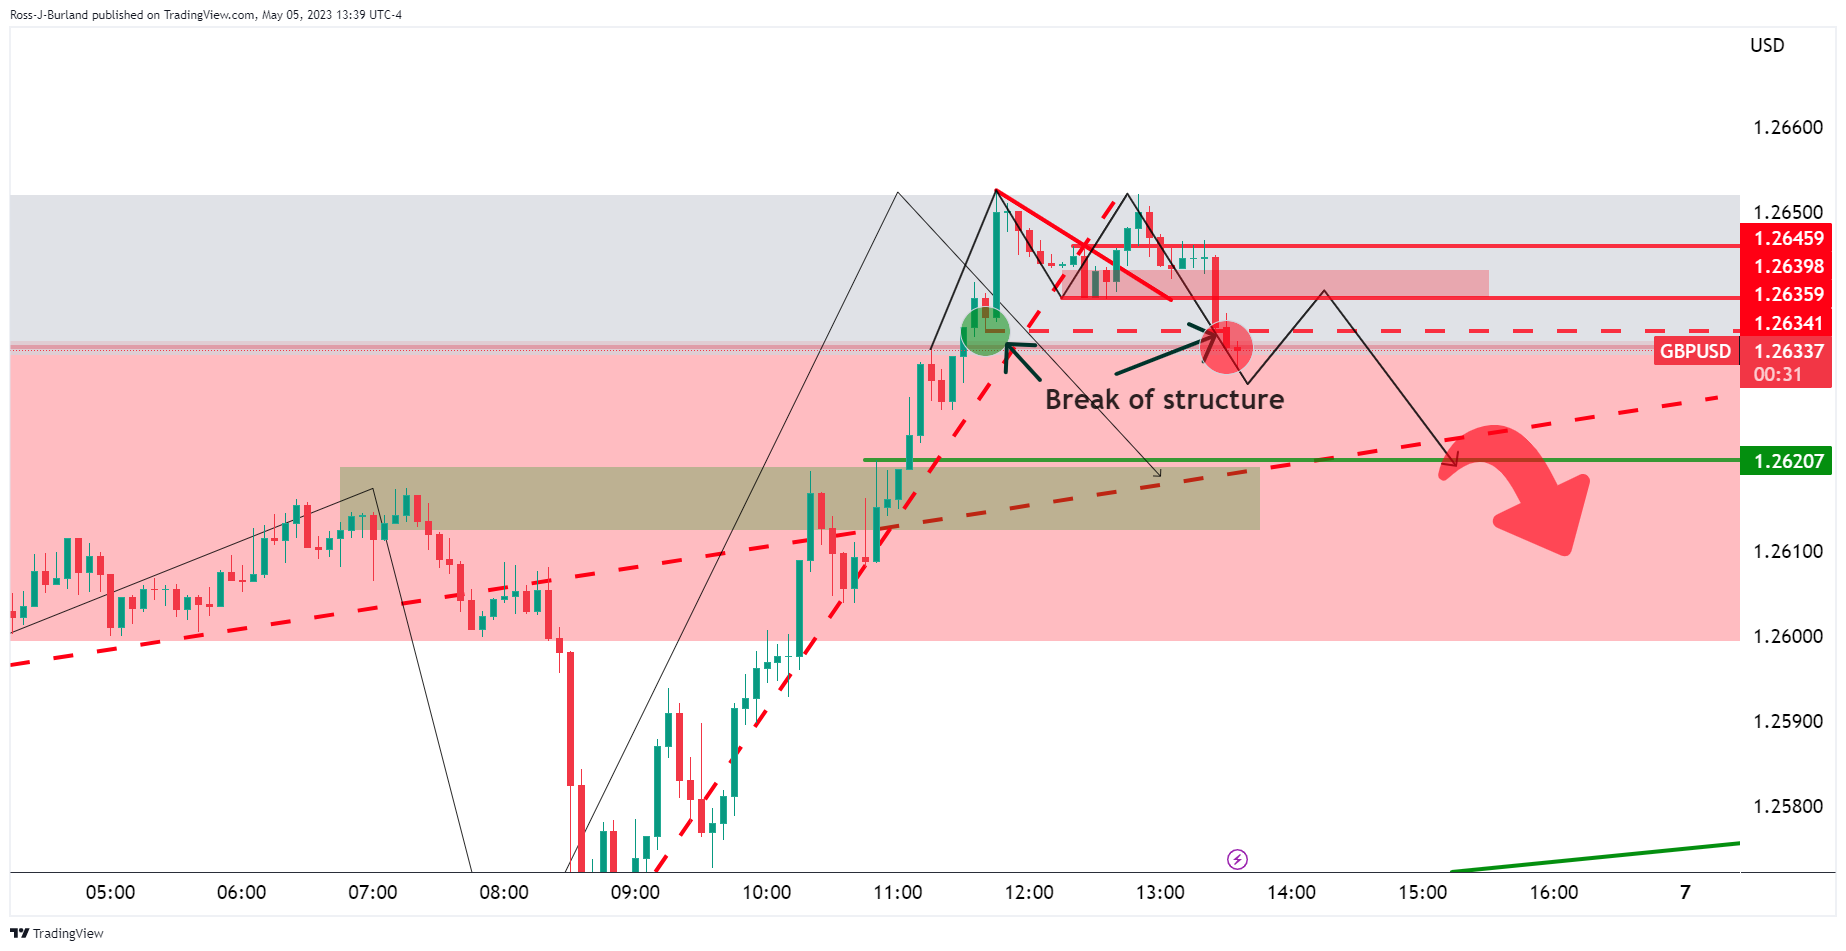
On the 15 and 5-min charts, we can see the price taking on a support structure.
The 5-min chart shows the price action up close and the break in structure offers prospects of a move lower whereby resistance could come in near 1.2640 if there is going to be a retest of the prior lows as illustrated in the chart above.
This article was originally published by Fxstreet.com. Read the original article here.


