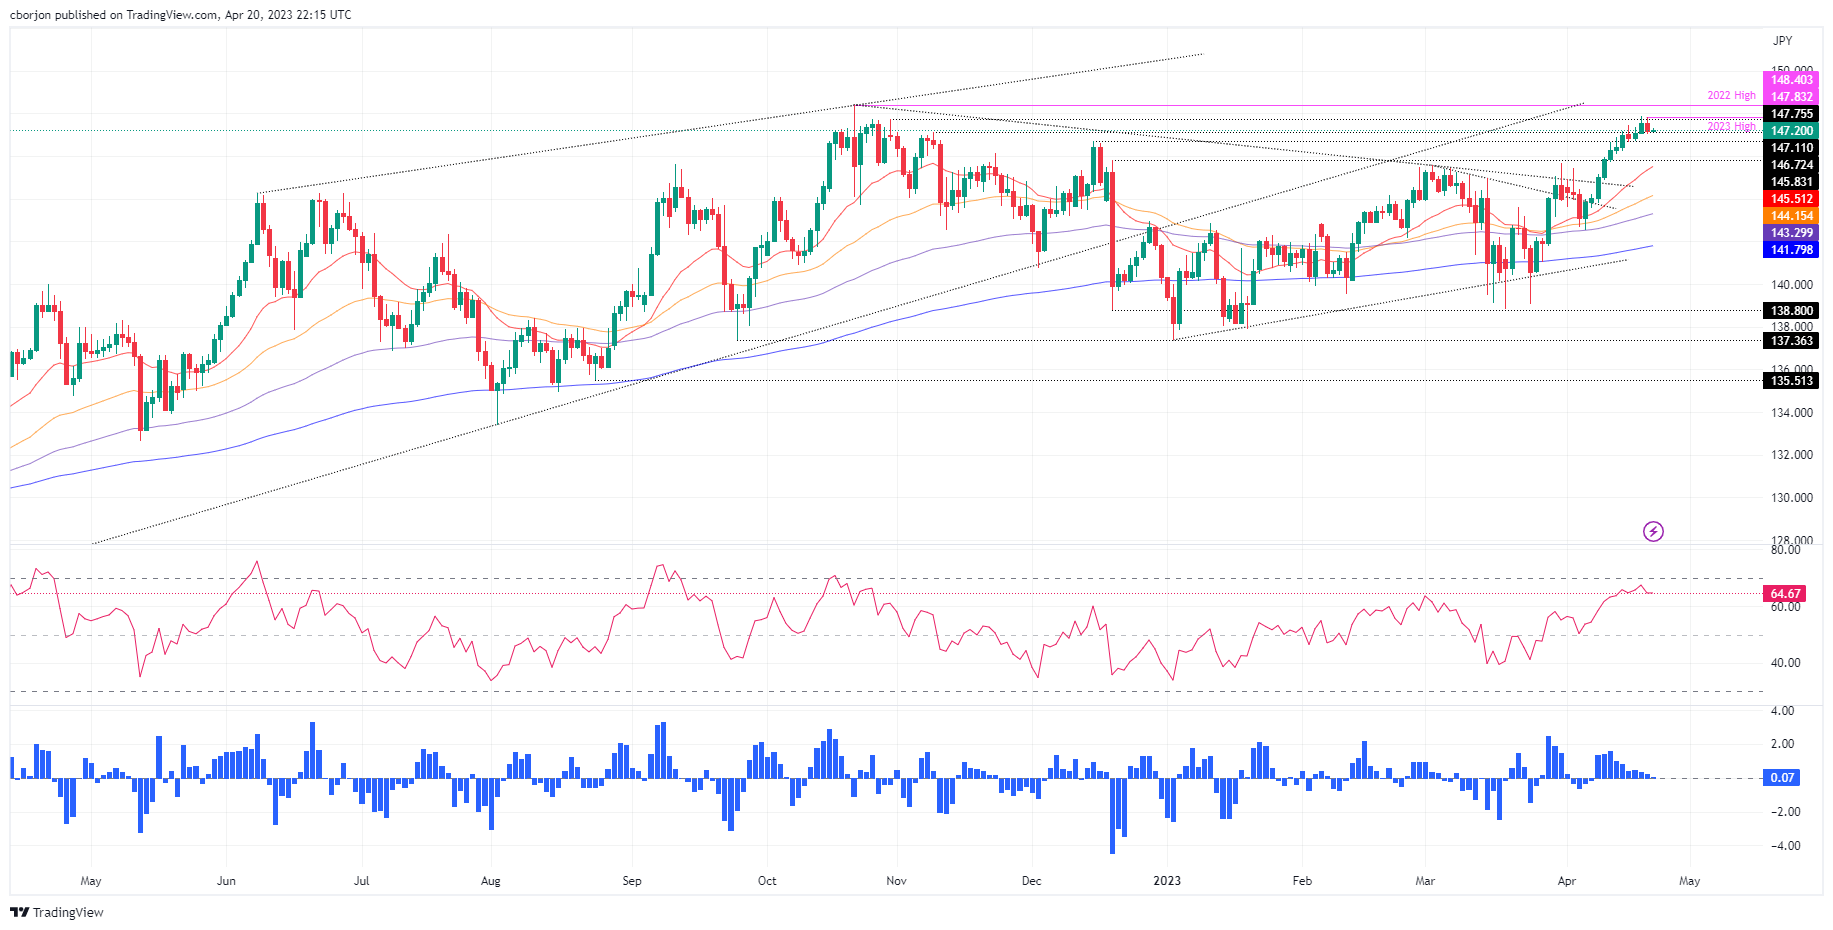
- Dark cloud cover in the EUR/JPY daily chart suggests a pullback could be underway.
- EUR/JPY sellers are losing momentum as oscillators shifted neutral.
The EUR/JPY retraced Wednesday’s gains on Thursday, as the pair formed a dark cloud cover. The two-candlestick chart pattern suggests the pair could be headed downwards, but a daily close below 147.02 is needed to confirm the chart pattern. As Friday’s Asian session begins, the EUR/JPY is trading at 147.25, registering minuscule gains of 0.04%.
EUR/JPY Price Action
EUR/JPY has managed to extend its rally past the 147.00 area, reaching a YTD high at 147.86; it retreated to the 147.20 area as oscillators turned flat, suggesting buyers are losing momentum. In addition, a forming dark cloud cover could open the door to test 147.00, a crucial area for buyers/sellers, which, once cleared, the latter will eye the 20-day Exponential Moving Average (EMA) at 145.52 as the first support to test.
If the EUR/JPY resumes downwards after challenging 145.52, the following support should be the psychological 145.00 figure, followed by the 50-day Exponential Moving Average (EMA) at 144.15.
On the other hand, if EUR/JPY stays above 147.00, that could pave the way for further upside. The EUR/JPY key resistance areas lie at the YTD high of 147.86, followed by the 148.00 mark. Break above; the EUR/JPY will challenge the 2022 high at 148.40.

