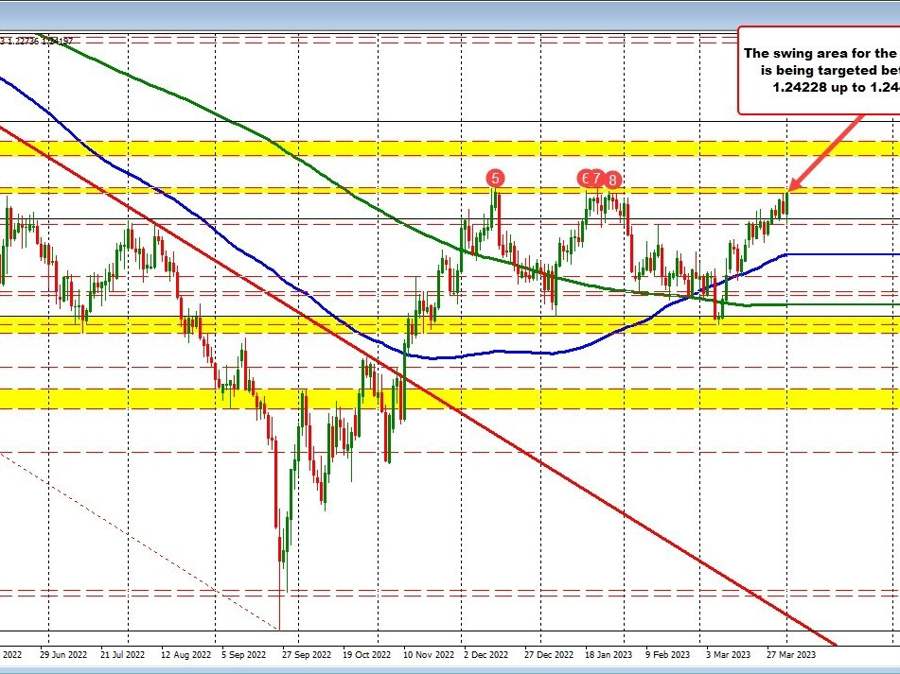
GBPUSD moves into a swing area on the daily chart
The GBPUSD is ticking to a new high as the day move closer to the close. In the process, the price on the daily chart has moved into a swing area between 1.24228 and 1.24458 (red numbered circles).
If the price moves above that area it would open the door for another swing area between 1.25987 and 1.2665 on the chart above (see green numbered circles).
Looking at the hourly chart, the correction in the US session was modest and did not approach the swing area between 1.2343 to 1.23603 OR the rising 100 hour MA (blue line on the chart below) at 1.23469. Those levels would need to be broken, to give sellers HERE, some satisfaction. Absence that, and the buyers are still holding the strongest hand (