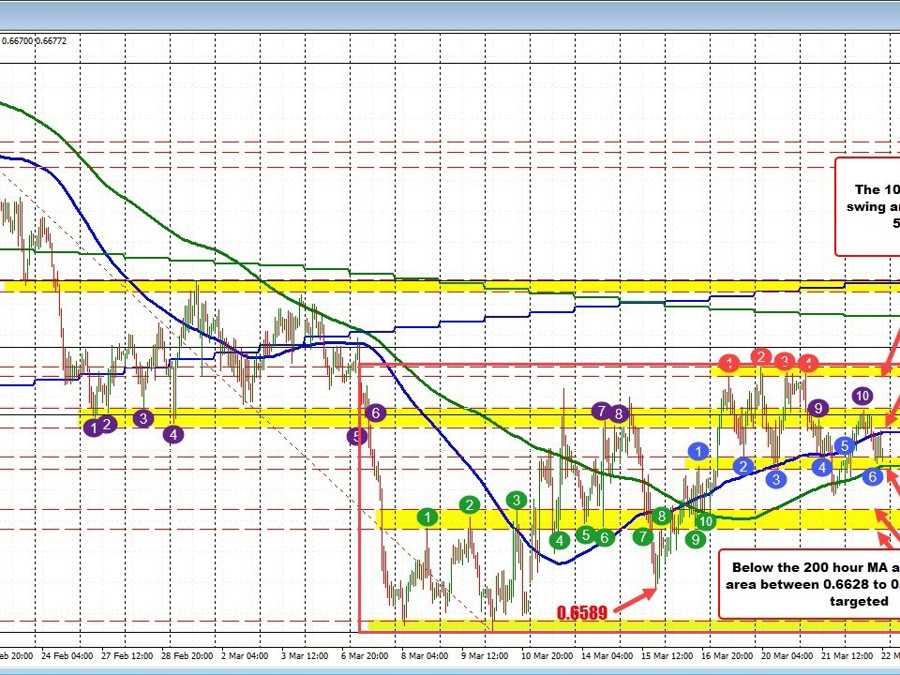
AUDUSD sits between the 100/200 are moving averages
The AUDUSD is trading between its 100 hour moving average (blue line) above, and 200 hour moving average (green line) below ahead of the FOMC rate decision. Those moving averages will help define the more bullish or more bearish bias.
There are a number of swing levels in play as targets.
On the top side, the purple numbered circles define a range between 0.6691 and 0.6703. Move above and traders will look toward the swing highs from Thursday, Friday and yesterday between 0.67239 and 0.67296. Move above that level and the 50% midpoint of the move down from the February 20 high comes a 0.67417.
On the downside, moved below the 200 hour moving average and a swing area between 0.6628 and 0.66399 (see green numbered circles) would be the next target to get to and through. Below that is the swing low from March 15 at 0.6589. And then traders will look toward the swing lows from March 8, and March 10 between 0.6563 and 0.6570.
Needless to say, since March 7 there has been a lot of up and down swings – intraday and overall – in the AUDUSD. The low extreme is defined at 0.6563. The high extreme is defined at 0.6729. In between sets the aforementioned swing areas that become targets to get to and through toward the extremes.
