
S&P 500 (SPX) rally from 10.13.2022 low was in 3 swing and ended wave (2) at 4194.16 as the 1 hour chart below shows. Wave (3) lower is now in progress as a 5 waves impulse Elliott Wave structure. Down from wave (2), wave ((i)) ended at 3943.08 and rally in wave ((ii)) ended at 4078.49. The Index extended lower again in wave ((iii)) towards 3842.91 and rally in wave ((iv)) ended at 3937.27. Final leg lower wave ((v)) ended at 3838.24 which completed wave 1. Wave 2 rally is now in progress to correct cycle from 2.3.2023 high.
$SPX 60 minutes Elliott Wave chart
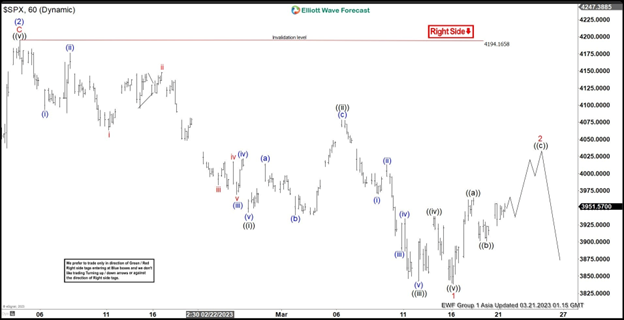
Internal of wave 2 is in progress as a zigzag Elliott Wave structure. Up from wave 1, wave ((a)) ended at 3964.46 and pullback in wave ((b)) ended at 3901.27. Final leg higher wave ((c)) is in progress to correct cycle from 2.3.2023 high before the decline resumes. Potential target higher is 100% – 161.8% Fibonacci extension of wave ((a)). The area comes at 4030.8 – 4110.1. From this area, sellers can appear and the Index can resume lower again. As far as pivot at 4194.16 high stays intact, expect rally to fail in 3, 7, or 11 swing for further downside.