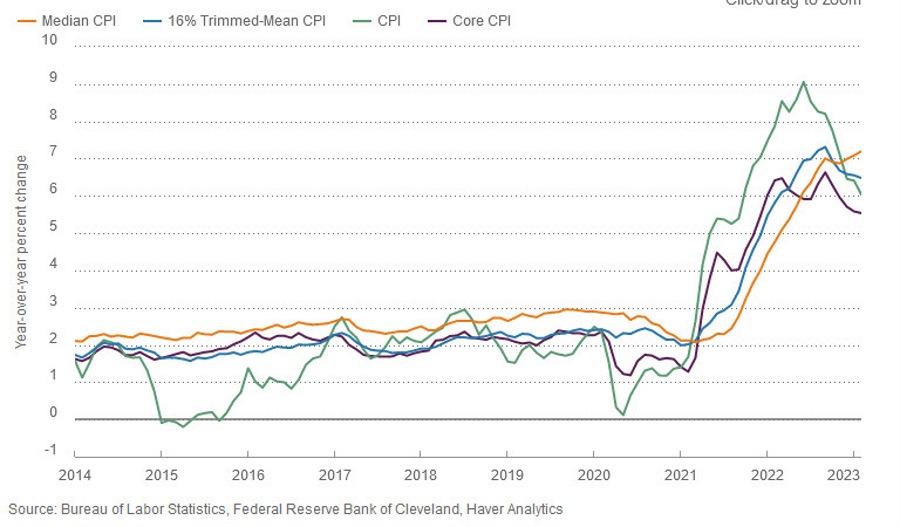
The Cleveland Fed does some of the math on the US CPI print to offer a picture of underlying inflation and it continues to be problematic.
- median CPI +0.6% m/m vs +0.7% prior
- 16% trimmed mean +0.5% vs +0.6% prior
- Median y/y 7.2% vs 7.1% prior
- 16% trimmed mean +6.5% vs +6.6% prior
At least it’s moving in the right direction.
Explanation of the indicator for the Cleveland Fed:
To calculate the median CPI, the Federal Reserve Bank of Cleveland looks
at the prices of the goods and services published by the Bureau of
Labor Statistics (BLS). But instead of calculating an inflation rate
that is a weighted average of all of the items in the CPI, as the BLS
does, the Cleveland Fed ranks the inflation rates of the components of
the CPI and picks the one in the middle of the distribution—that is, the
item whose expenditure weight is in the 50th percentile of the price
change distribution. The Cleveland Fed also calculates the 16 percent
trimmed-mean CPI by taking a weighted average across the component
inflation rates after excluding, or trimming, items whose expenditure
weights fall in the top 8 percent and bottom 8 percent of the price
change distribution.
The Cleveland Fed also has a Nowcast for March CPI that’s running at +0.3% on the headline and +0.45% on core.
