The 2 year yield got within 4 bps of its 200 day MA
The USDJPY is reacting higher on the back of the move off lows in yields. The 2 year yield (see chart above) moved back up to 4.266% from an intraday low just below 4.00% at 3.997%. The yield is now only down -37 basis points. It was down close to -60 basis points at the lows.
Looking at the daily chart of the 2 year, the low yield today did get within about 4 basis points of the 200 day MA. The yield has not been below the 200 day MA since August 2021.
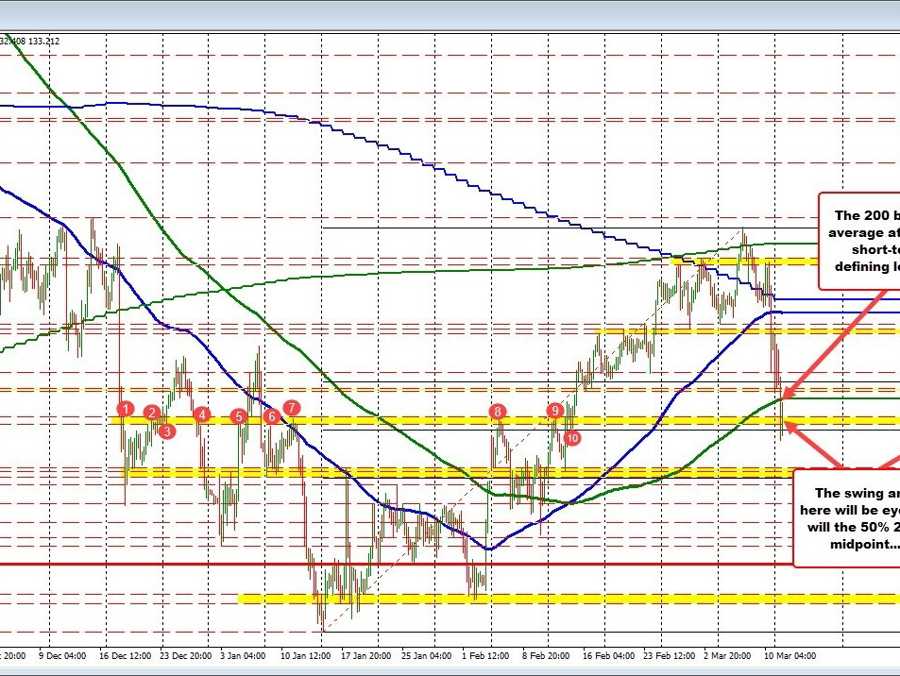
For the USDJPY, the price moved up to test its 200 bar moving average on the four hour chart (see chart below). That moving average comes in at 133.374. The high price has reached 133.295. The price is coming off of that level as the 2 year yield has already moved back down to 4.15% as I type. Man….things can move quickly.
USDJPY retests the 200 bar MA
In any case, the 200 bar moving average on the 4 hour chart remains a topside barometer given the sharp move to the downside seen over the last few trading days. The high for the USDJPY reached 137.906 on Wednesday. The price had moved down 560 pips from that high. A corrective move higher is not that surprising. Having said that, however, the yield move back to the upside and stock rebound has been helpful.
Nevertheless, it would still take a move above the 200 bar moving average at 133.374 to get over that hump. Above that there will be other targets including 133.65 and the broken 38.2% retracement of the 2023 trading range at 133.83.
On the downside, getting below a swing area between 132.70 – 132.90 and then the 50% midpoint of the 2023 trading range at 132.558 and things start to tilt even more to the downside.
Earlier today, that midpoint level was broken, but momentum faded with the turnaround in yields and stocks.A 2nd break, should lead to more selling, however.
