- Silver price takes offers to refresh multi-day low during three-day downtrend.
- Clear break of six-month-old support line, the key Fibonacci retracement level joins bearish MACD signals to favor XAG/USD sellers.
- 200-DMA, monthly resistance line add to the upside filters.
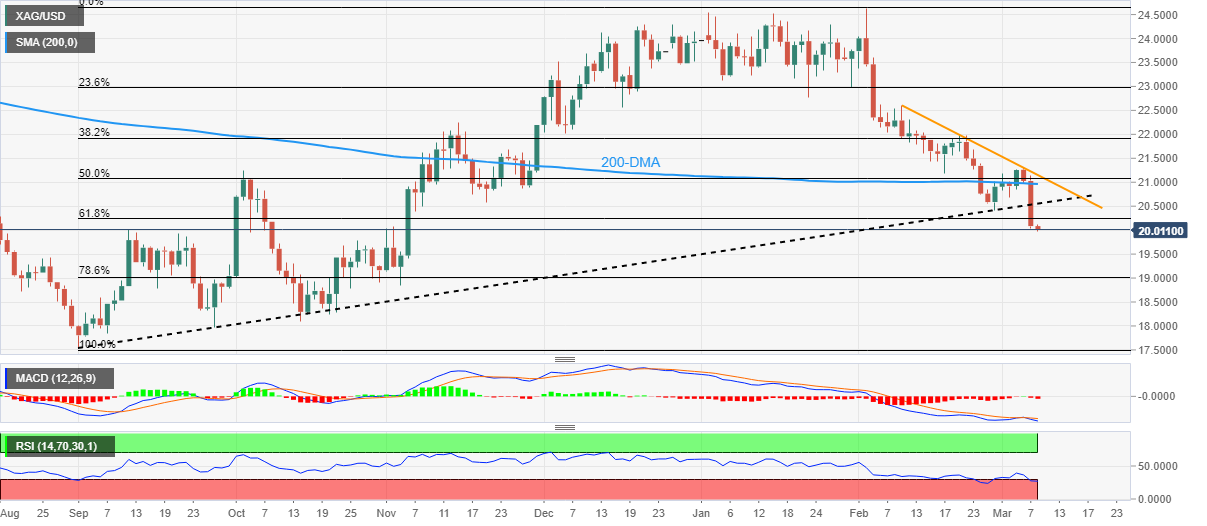
Silver price (XAG/USD) remains depressed at the lowest levels in four months as sellers poke the $20.00 psychological magnet to refresh the multi-day low during Wednesday’s Asian session.
In doing so, the bright metal extends the previous day’s downside break of a six-month-old ascending support line, as well as the 61.8% Fibonacci retracement level of the metal’s run-up from September 2022 to February 2023. Adding strength to the downside bias are the bearish MACD signals.
It’s worth noting, however, that the RSI (14) is in the oversold territory and hence multiple supports around $19.80 and $19.60 could restrict short-term XAG/USD declines.
Following that, the 78.6% Fibonacci retracement level surrounding the $19.00 round figure could lure the Silver bears before directing them to the lows marked during the last October and September, respectively near $18.10 and $17.55.
Meanwhile, the 61.8% Fibonacci retracement level, also known as the golden Fibonacci ratio, could restrict short-term XAG/USD recovery at around $20.25 before the support-turned-resistance line from September 2022, close to $20.60 by the press time.
In a case where the Silver price remains firmer past $20.60, the 200-DMA and a one-month-old resistance line, around $21.00 and $21.20, may act as the last defenses of the XAG/USD bears.
Silver price: Daily chart
Trend: Further downside expected

