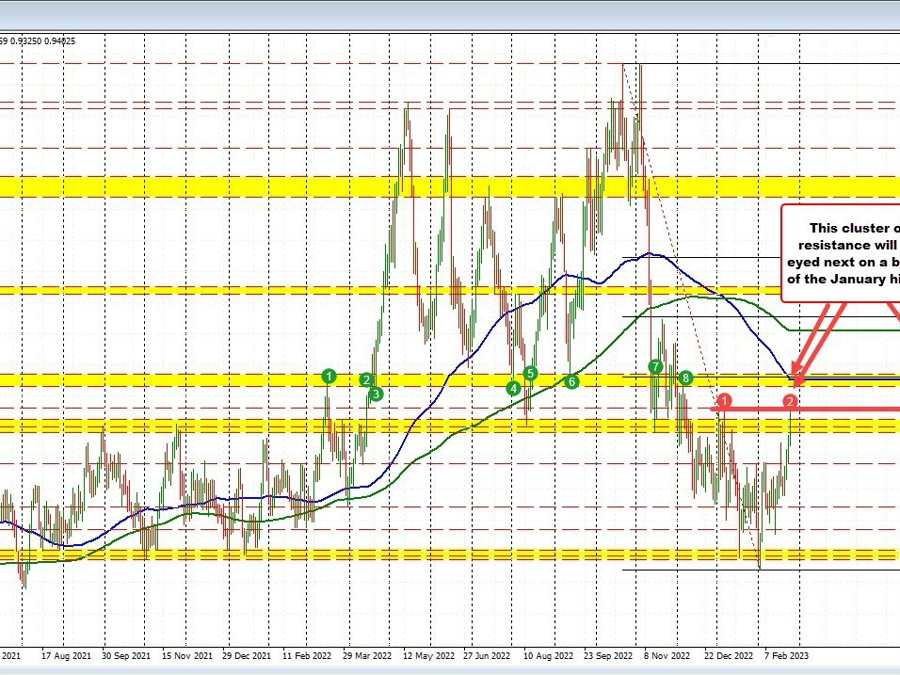
USDCHF tests the swing high from January
The USDCHF is stretching to the January and 2023 high at 0.94069. The price just reached 0.94058. There is some symmetry in the daily chart for the year. The move to the downside from the high took 19 days. The move back to the upside in February is on day 16.
Looking at the chart, the low price reached on February 2nd took the price below the low floor area between 0.9081 and 0.91014. The low price extended to 0.90586 on the break of the floor, but momentum could be sustained and the price quickly started to rebound back to the upside.
With the dollar bias continuing the move higher with some pairs either testing or breaking through some key technical levels (the GBPUSD is testing its 100/200 day MA, the AUDUSD is testing its 100 day MA. The NZDUSD broken below both its 100/200 day MAs today), if the tilt continues, pairs like the USDCHF has the falling 100 day MA above at 0.9469 (and moving lower) and the 38.2% of the move down from the 2022 high at 0.94744 as targets above.
Both those levels are within a swing area between 0.9453 and 0.9479 (see green numbered circles).
Looking at the hourly chart, the price today moved above the topside trend line . That trend line will be at 0.9379 at the end of day. That level will be a close risk level for traders going forward especially if the price holds here. ON a break below, we could see more corrective action from the run higher.
USDCHF on the hourly

 RULE-BASED Pocket Option Strategy That Actually Works | Live Trading